
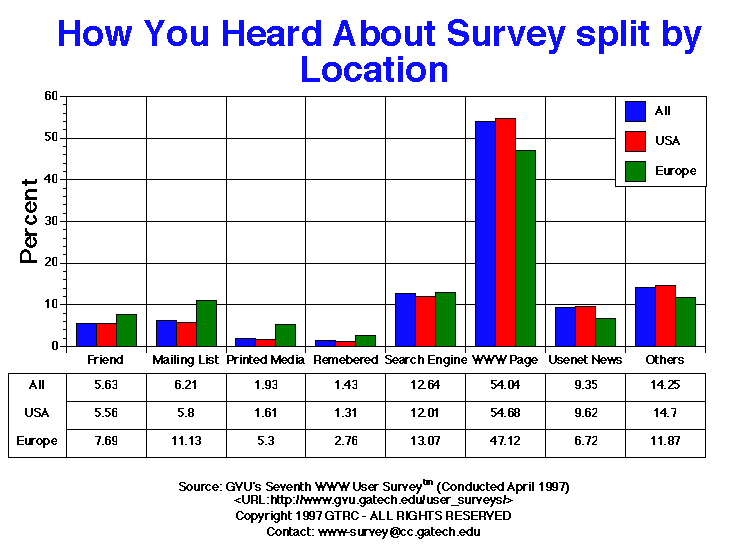
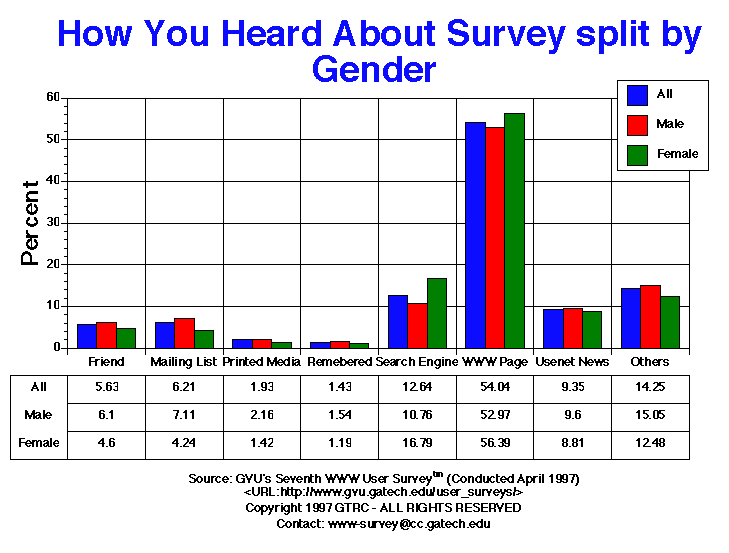
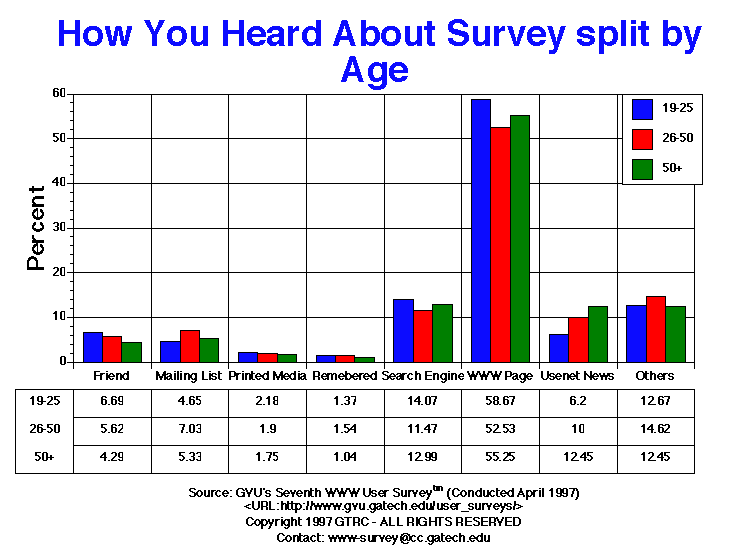
| How You Heard About Survey | All | Male | Female | USA | Europe | 19-25 | 26-50 | 50+ |
| Friend | 1103.00 5.63% |
821.00 6.10% |
282.00 4.60% |
872.00 5.56% |
103.00 7.69% |
249.00 6.69% |
660.00 5.62% |
103.00 4.29% |
| Mailing List | 1216.00 6.21% |
956.00 7.11% |
260.00 4.24% |
909.00 5.80% |
149.00 11.13% |
173.00 4.65% |
825.00 7.03% |
128.00 5.33% |
| Others | 2790.00 14.25% |
2025.00 15.05% |
765.00 12.48% |
2305.00 14.70% |
159.00 11.87% |
472.00 12.67% |
1716.00 14.62% |
299.00 12.45% |
| Printed Media | 377.00 1.93% |
290.00 2.16% |
87.00 1.42% |
253.00 1.61% |
71.00 5.30% |
81.00 2.18% |
223.00 1.90% |
42.00 1.75% |
| Remebered | 280.00 1.43% |
207.00 1.54% |
73.00 1.19% |
205.00 1.31% |
37.00 2.76% |
51.00 1.37% |
181.00 1.54% |
25.00 1.04% |
| Search Engine | 2476.00 12.64% |
1447.00 10.76% |
1029.00 16.79% |
1883.00 12.01% |
175.00 13.07% |
524.00 14.07% |
1346.00 11.47% |
312.00 12.99% |
| Usenet News | 1831.00 9.35% |
1291.00 9.60% |
540.00 8.81% |
1508.00 9.62% |
90.00 6.72% |
231.00 6.20% |
1174.00 10.00% |
299.00 12.45% |
| WWW Page | 10582.00 54.04% |
7126.00 52.97% |
3456.00 56.39% |
8571.00 54.68% |
631.00 47.12% |
2185.00 58.67% |
6166.00 52.53% |
1327.00 55.25% |
GVU's WWW Surveying Team
Graphics, Visualization, & Usability Center
College of Computing
Georgia Institute of Technology
Atlanta, GA 30332-0280