Language Specific Sites
Notes:
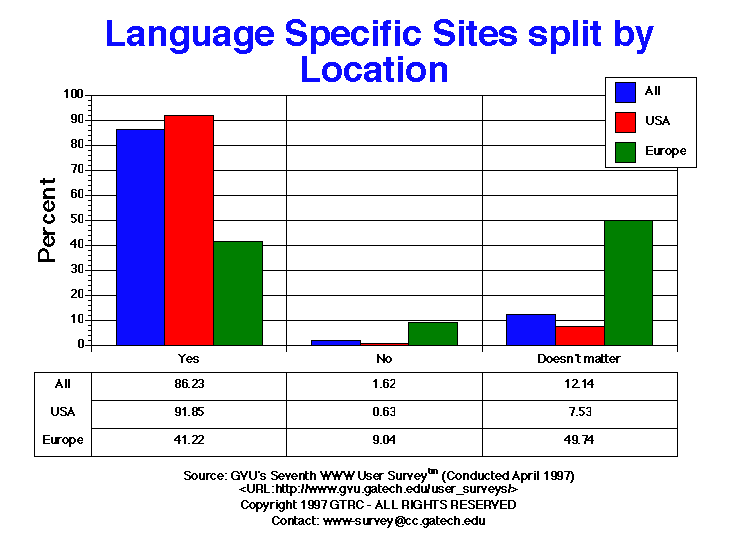
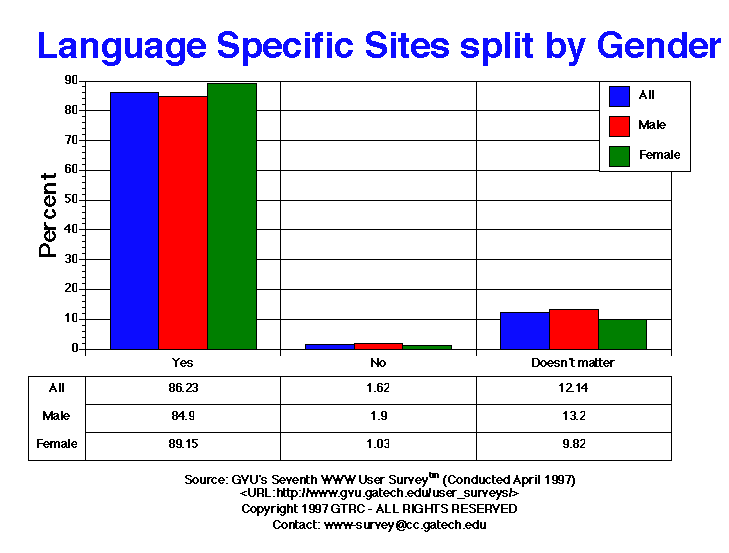
- This is a new question to the Seventh Survey, which asked: "Do you prefer to access web sites in your first (native) language?" This question reveal a major geographical difference, with 91.85% of the US users stating that they prefer sites in their first language (English), with
only 41.22% of the European users sharing the same preference. The majority of European users report that it does not matter (49.74%).
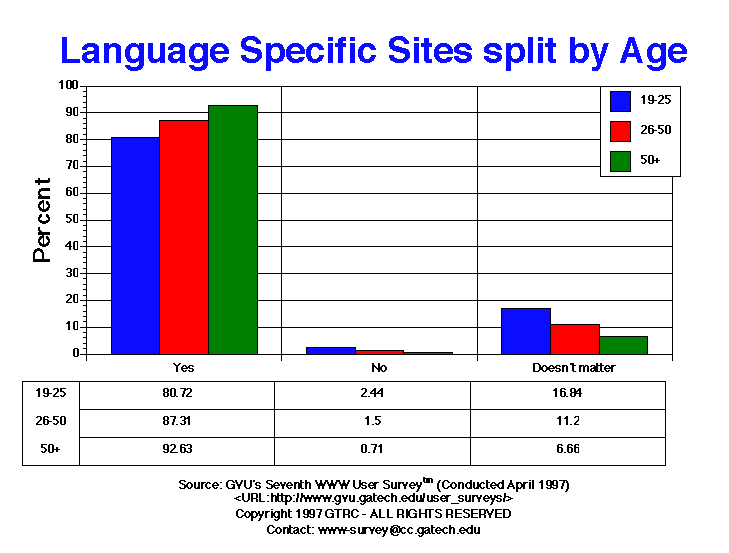
One possible reason for this result is that Europeans tend to be multi-lingual, whereas their US counterparts tend to mainly speak English. Younger users do not feel that the language of the site matters as much as older users (16.84% 19-25 yre. old vs 6.66% 50+ yr. old).
Table of Data for All Categories
| Language Specific Sites |
All |
Male |
Female |
USA |
Europe |
19-25 |
26-50 |
50+ |
| Doesn't matter |
2378.00 12.14% |
1776.00 13.20% |
602.00 9.82% |
1180.00 7.53% |
666.00 49.74% |
627.00 16.84% |
1314.00 11.20% |
160.00 6.66% |
| No |
318.00 1.62% |
255.00 1.90% |
63.00 1.03% |
98.00 0.63% |
121.00 9.04% |
91.00 2.44% |
176.00 1.50% |
17.00 0.71% |
| Yes |
16887.00 86.23% |
11423.00 84.90% |
5464.00 89.15% |
14398.00 91.85% |
552.00 41.22% |
3006.00 80.72% |
10247.00 87.31% |
2225.00 92.63% |


For more information or to submit comments:
send e-mail to www-survey@cc.gatech.edu.
GVU's WWW Surveying Team
Graphics, Visualization, & Usability Center
College of Computing
Georgia Institute of Technology
Atlanta, GA 30332-0280


