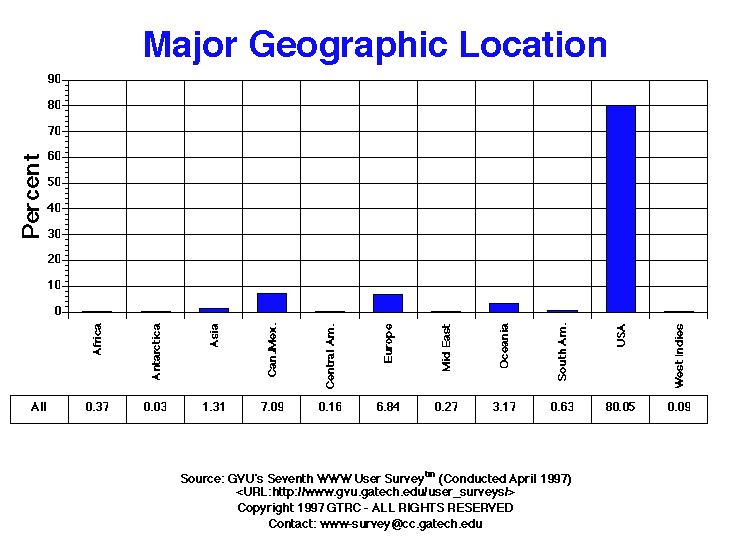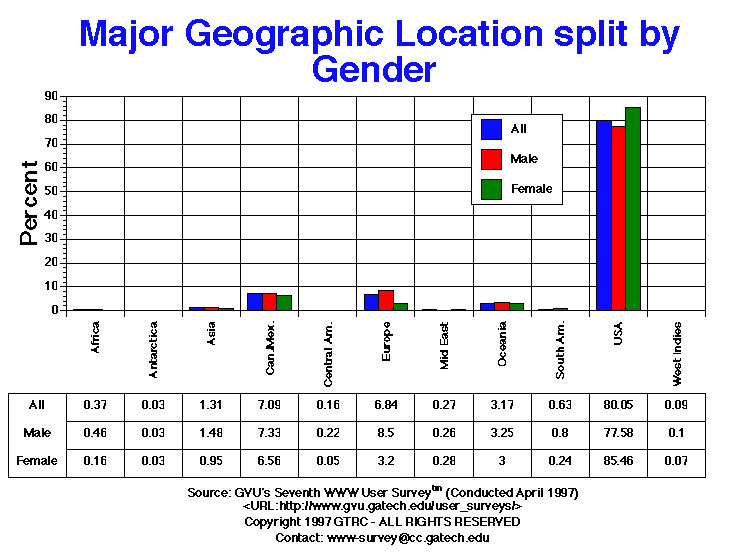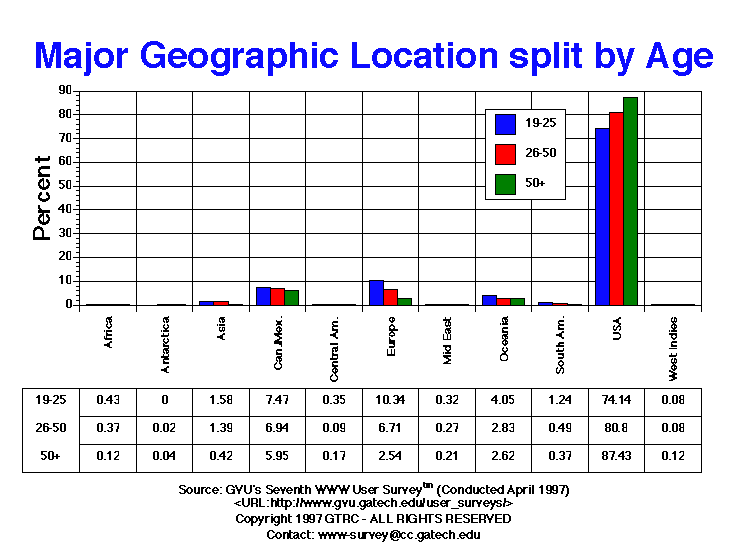

| Major Geographical Location | All | Male | Female | USA | Europe | 19-25 | 26-50 | 50+ |
| Africa | 72.00 0.37% |
62.00 0.46% |
10.00 0.16% |
0.00 0.00% |
0.00 0.00% |
16.00 0.43% |
43.00 0.37% |
3.00 0.12% |
| Antarctica | 6.00 0.03% |
4.00 0.03% |
2.00 0.03% |
0.00 0.00% |
0.00 0.00% |
0.00 0.00% |
2.00 0.02% |
1.00 0.04% |
| Asia | 257.00 1.31% |
199.00 1.48% |
58.00 0.95% |
0.00 0.00% |
0.00 0.00% |
59.00 1.58% |
163.00 1.39% |
10.00 0.42% |
| Canada & Mexico | 1388.00 7.09% |
986.00 7.33% |
402.00 6.56% |
0.00 0.00% |
0.00 0.00% |
278.00 7.47% |
815.00 6.94% |
143.00 5.95% |
| Central America | 32.00 0.16% |
29.00 0.22% |
3.00 0.05% |
0.00 0.00% |
0.00 0.00% |
13.00 0.35% |
11.00 0.09% |
4.00 0.17% |
| Europe | 1339.00 6.84% |
1143.00 8.50% |
196.00 3.20% |
0.00 0.00% |
1339.00 100.00% |
385.00 10.34% |
788.00 6.71% |
61.00 2.54% |
| Middle East | 52.00 0.27% |
35.00 0.26% |
17.00 0.28% |
0.00 0.00% |
0.00 0.00% |
12.00 0.32% |
32.00 0.27% |
5.00 0.21% |
| Oceania | 621.00 3.17% |
437.00 3.25% |
184.00 3.00% |
0.00 0.00% |
0.00 0.00% |
151.00 4.05% |
332.00 2.83% |
63.00 2.62% |
| South America | 123.00 0.63% |
108.00 0.80% |
15.00 0.24% |
0.00 0.00% |
0.00 0.00% |
46.00 1.24% |
58.00 0.49% |
9.00 0.37% |
| USA | 15676.00 80.05% |
10438.00 77.58% |
5238.00 85.46% |
15676.00 100.00% |
0.00 0.00% |
2761.00 74.14% |
9484.00 80.80% |
2100.00 87.43% |
| West Indies | 17.00 0.09% |
13.00 0.10% |
4.00 0.07% |
0.00 0.00% |
0.00 0.00% |
3.00 0.08% |
9.00 0.08% |
3.00 0.12% |


GVU's WWW Surveying Team
Graphics, Visualization, & Usability Center
College of Computing
Georgia Institute of Technology
Atlanta, GA 30332-0280