
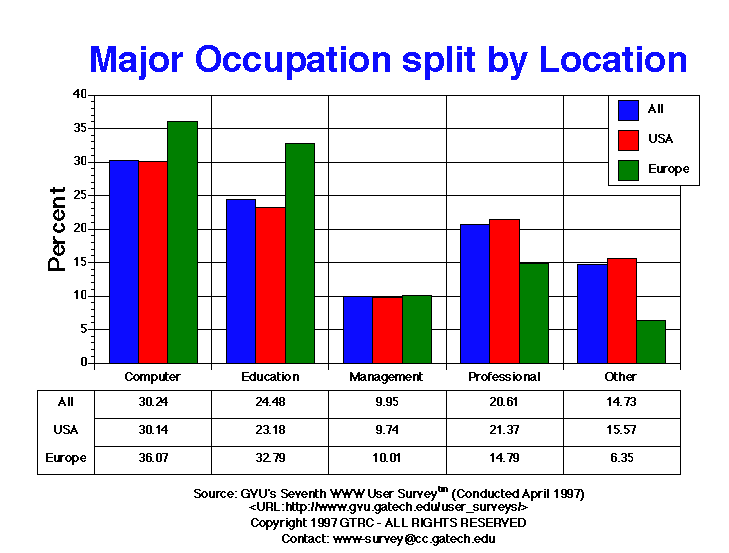
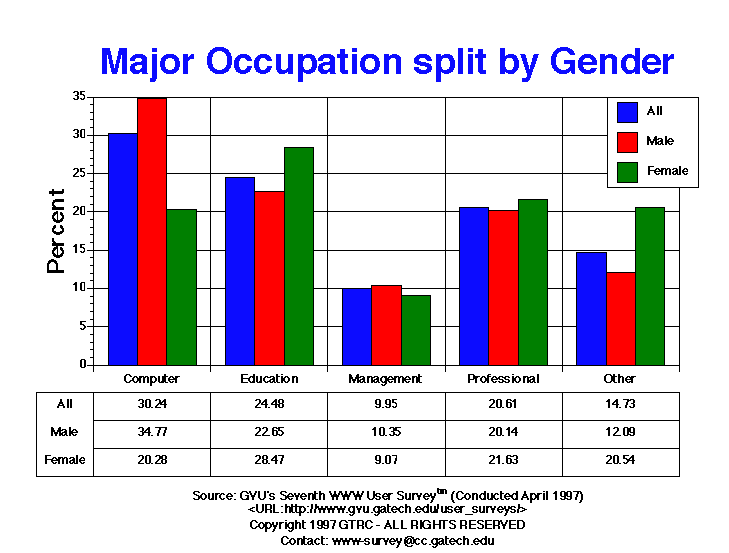
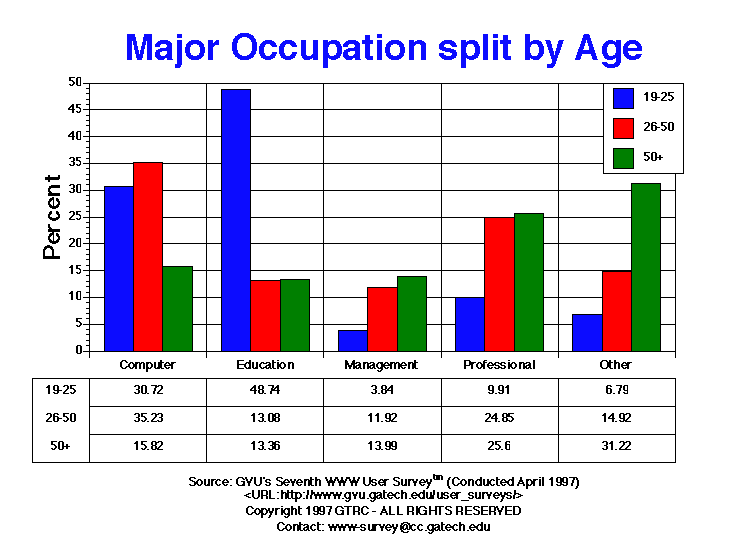
| Major Occupation | All | Male | Female | USA | Europe | 19-25 | 26-50 | 50+ |
| Computer | 5921.00 30.24% |
4678.00 34.77% |
1243.00 20.28% |
4725.00 30.14% |
483.00 36.07% |
1144.00 30.72% |
4135.00 35.23% |
380.00 15.82% |
| Education | 4793.00 24.48% |
3048.00 22.65% |
1745.00 28.47% |
3633.00 23.18% |
439.00 32.79% |
1815.00 48.74% |
1535.00 13.08% |
321.00 13.36% |
| Management | 1948.00 9.95% |
1392.00 10.35% |
556.00 9.07% |
1527.00 9.74% |
134.00 10.01% |
143.00 3.84% |
1399.00 11.92% |
336.00 13.99% |
| Other | 2885.00 14.73% |
1626.00 12.09% |
1259.00 20.54% |
2441.00 15.57% |
85.00 6.35% |
253.00 6.79% |
1751.00 14.92% |
750.00 31.22% |
| Professional | 4036.00 20.61% |
2710.00 20.14% |
1326.00 21.63% |
3350.00 21.37% |
198.00 14.79% |
369.00 9.91% |
2917.00 24.85% |
615.00 25.60% |
GVU's WWW Surveying Team
Graphics, Visualization, & Usability Center
College of Computing
Georgia Institute of Technology
Atlanta, GA 30332-0280