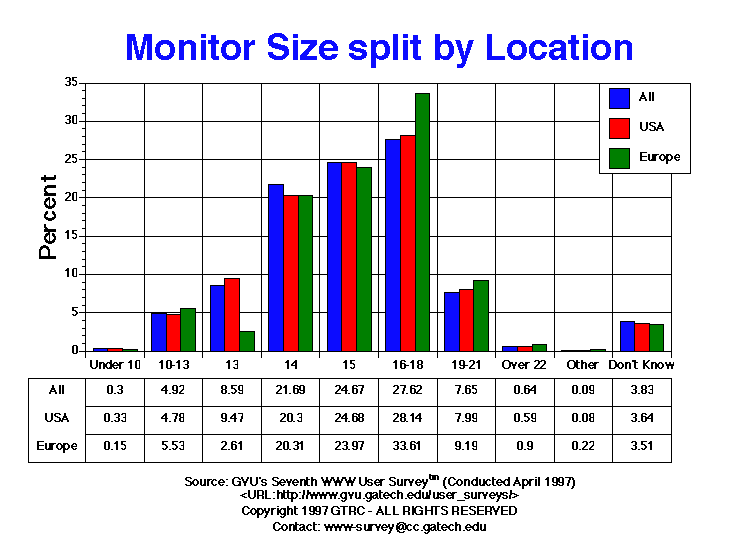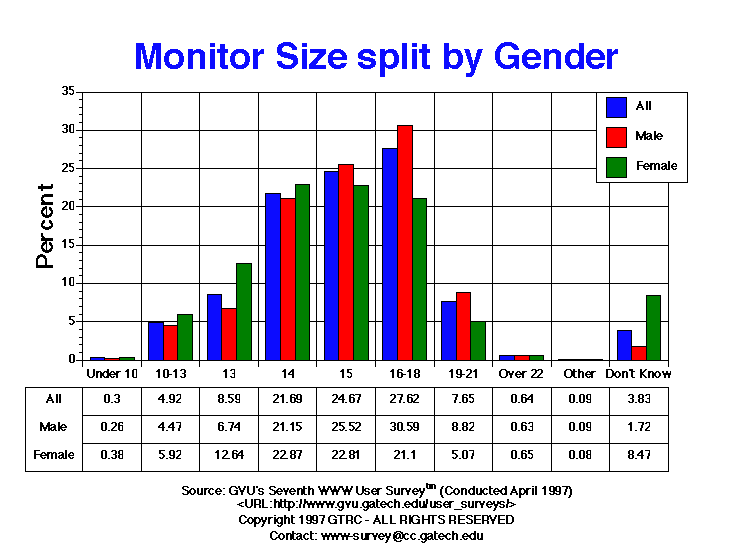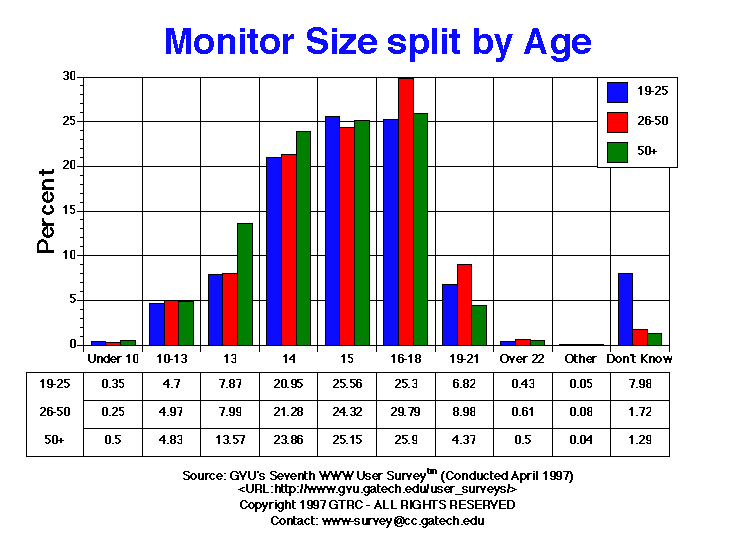

| Monitor Screen Size | All | Male | Female | USA | Europe | 19-25 | 26-50 | 50+ |
| 10-13 | 964.00 4.92% |
601.00 4.47% |
363.00 5.92% |
750.00 4.78% |
74.00 5.53% |
175.00 4.70% |
583.00 4.97% |
116.00 4.83% |
| 13 | 1682.00 8.59% |
907.00 6.74% |
775.00 12.64% |
1485.00 9.47% |
35.00 2.61% |
293.00 7.87% |
938.00 7.99% |
326.00 13.57% |
| 14 | 4248.00 21.69% |
2846.00 21.15% |
1402.00 22.87% |
3182.00 20.30% |
272.00 20.31% |
780.00 20.95% |
2498.00 21.28% |
573.00 23.86% |
| 15 | 4832.00 24.67% |
3434.00 25.52% |
1398.00 22.81% |
3869.00 24.68% |
321.00 23.97% |
952.00 25.56% |
2855.00 24.32% |
604.00 25.15% |
| 16-18 | 5409.00 27.62% |
4116.00 30.59% |
1293.00 21.10% |
4412.00 28.14% |
450.00 33.61% |
942.00 25.30% |
3497.00 29.79% |
622.00 25.90% |
| 19-21 | 1498.00 7.65% |
1187.00 8.82% |
311.00 5.07% |
1253.00 7.99% |
123.00 9.19% |
254.00 6.82% |
1054.00 8.98% |
105.00 4.37% |
| Don't Know | 750.00 3.83% |
231.00 1.72% |
519.00 8.47% |
570.00 3.64% |
47.00 3.51% |
297.00 7.98% |
202.00 1.72% |
31.00 1.29% |
| Other | 17.00 0.09% |
12.00 0.09% |
5.00 0.08% |
12.00 0.08% |
3.00 0.22% |
2.00 0.05% |
9.00 0.08% |
1.00 0.04% |
| Over 22 | 125.00 0.64% |
85.00 0.63% |
40.00 0.65% |
92.00 0.59% |
12.00 0.90% |
16.00 0.43% |
72.00 0.61% |
12.00 0.50% |
| Under 10 | 58.00 0.30% |
35.00 0.26% |
23.00 0.38% |
51.00 0.33% |
2.00 0.15% |
13.00 0.35% |
29.00 0.25% |
12.00 0.50% |


GVU's WWW Surveying Team
Graphics, Visualization, & Usability Center
College of Computing
Georgia Institute of Technology
Atlanta, GA 30332-0280