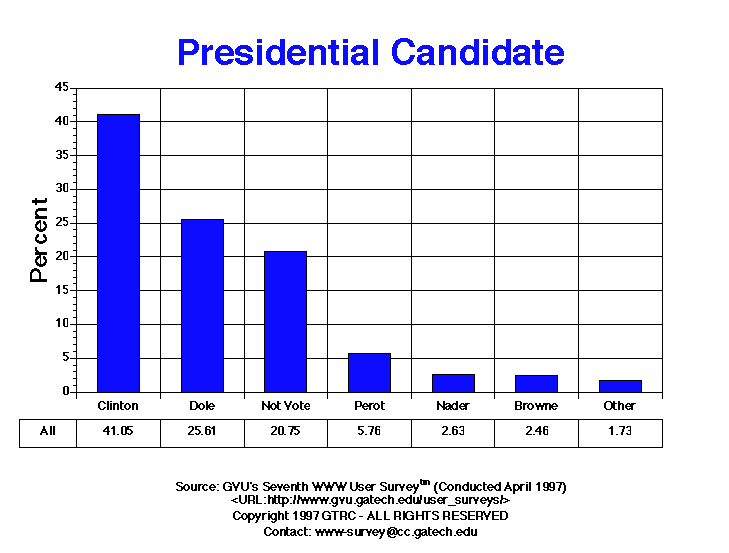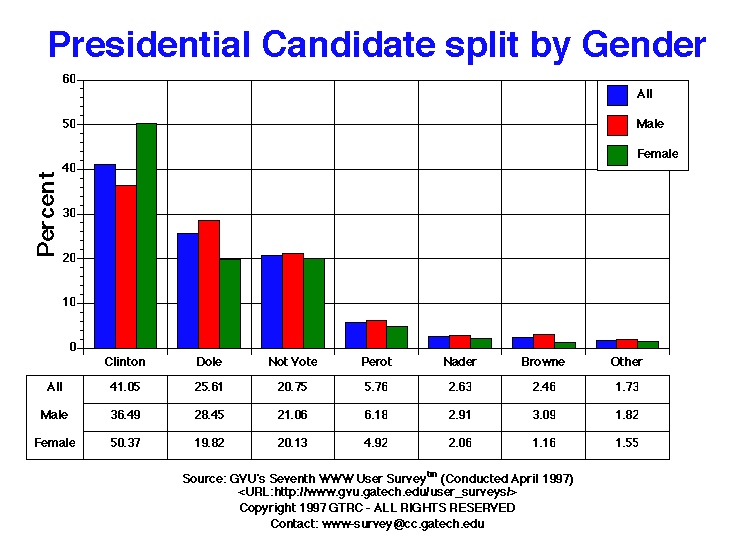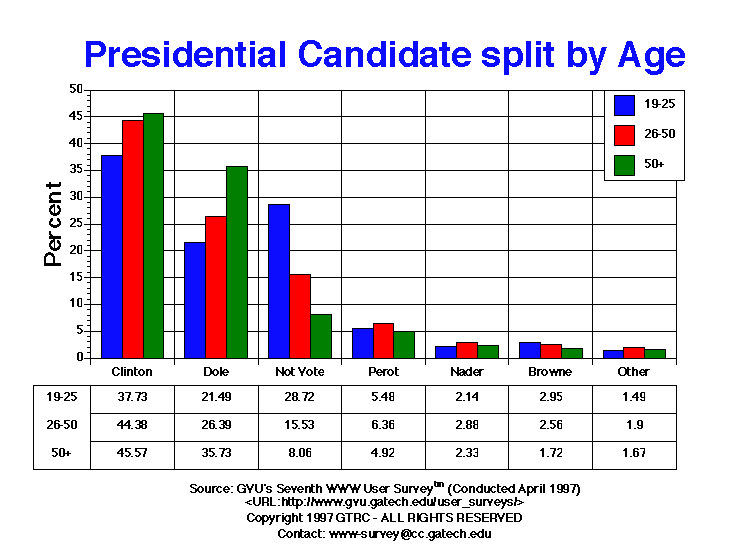

| Presidential Candidate | All | Male | Female | USA | Europe | 19-25 | 26-50 | 50+ |
| Browne | 356.00 2.46% |
301.00 3.09% |
55.00 1.16% |
356.00 2.46% |
0.00 0.00% |
77.00 2.95% |
224.00 2.56% |
34.00 1.72% |
| Clinton | 5946.00 41.05% |
3549.00 36.49% |
2397.00 50.37% |
5946.00 41.05% |
0.00 0.00% |
985.00 37.73% |
3880.00 44.38% |
899.00 45.57% |
| Dole | 3710.00 25.61% |
2767.00 28.45% |
943.00 19.82% |
3710.00 25.61% |
0.00 0.00% |
561.00 21.49% |
2307.00 26.39% |
705.00 35.73% |
| Nader | 381.00 2.63% |
283.00 2.91% |
98.00 2.06% |
381.00 2.63% |
0.00 0.00% |
56.00 2.14% |
252.00 2.88% |
46.00 2.33% |
| Not Vote | 3006.00 20.75% |
2048.00 21.06% |
958.00 20.13% |
3006.00 20.75% |
0.00 0.00% |
750.00 28.72% |
1358.00 15.53% |
159.00 8.06% |
| Other | 251.00 1.73% |
177.00 1.82% |
74.00 1.55% |
251.00 1.73% |
0.00 0.00% |
39.00 1.49% |
166.00 1.90% |
33.00 1.67% |
| Perot | 835.00 5.76% |
601.00 6.18% |
234.00 4.92% |
835.00 5.76% |
0.00 0.00% |
143.00 5.48% |
556.00 6.36% |
97.00 4.92% |


GVU's WWW Surveying Team
Graphics, Visualization, & Usability Center
College of Computing
Georgia Institute of Technology
Atlanta, GA 30332-0280