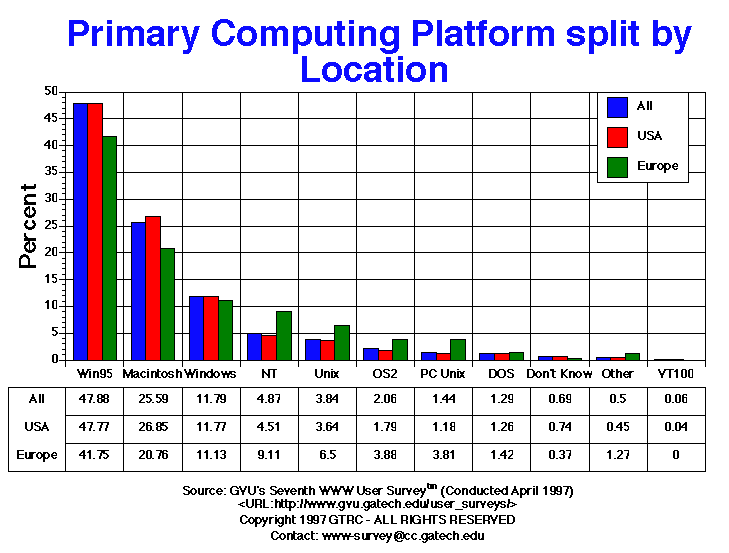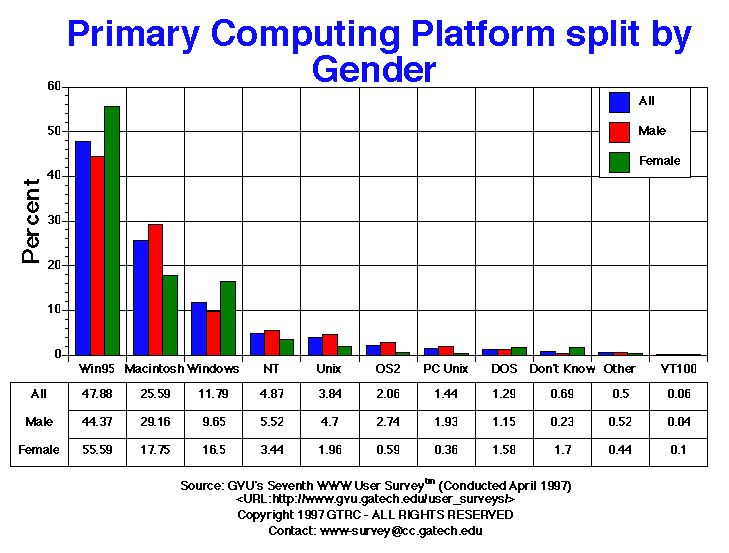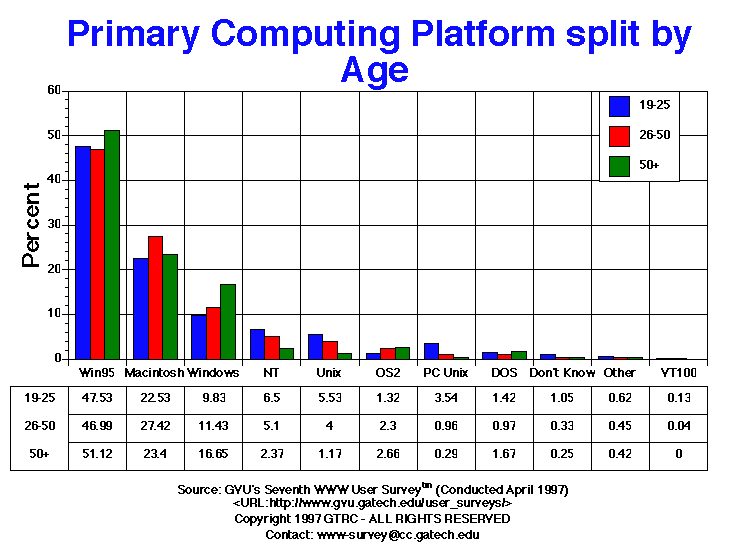

| Primary Computing Platform | All | Male | Female | USA | Europe | 19-25 | 26-50 | 50+ |
| DOS | 252.00 1.29% |
155.00 1.15% |
97.00 1.58% |
197.00 1.26% |
19.00 1.42% |
53.00 1.42% |
114.00 0.97% |
40.00 1.67% |
| Don't Know | 135.00 0.69% |
31.00 0.23% |
104.00 1.70% |
116.00 0.74% |
5.00 0.37% |
39.00 1.05% |
39.00 0.33% |
6.00 0.25% |
| Macintosh | 5011.00 25.59% |
3923.00 29.16% |
1088.00 17.75% |
4209.00 26.85% |
278.00 20.76% |
839.00 22.53% |
3218.00 27.42% |
562.00 23.40% |
| NT | 953.00 4.87% |
742.00 5.52% |
211.00 3.44% |
707.00 4.51% |
122.00 9.11% |
242.00 6.50% |
599.00 5.10% |
57.00 2.37% |
| OS2 | 404.00 2.06% |
368.00 2.74% |
36.00 0.59% |
281.00 1.79% |
52.00 3.88% |
49.00 1.32% |
270.00 2.30% |
64.00 2.66% |
| Other | 97.00 0.50% |
70.00 0.52% |
27.00 0.44% |
70.00 0.45% |
17.00 1.27% |
23.00 0.62% |
53.00 0.45% |
10.00 0.42% |
| PC Unix | 282.00 1.44% |
260.00 1.93% |
22.00 0.36% |
185.00 1.18% |
51.00 3.81% |
132.00 3.54% |
113.00 0.96% |
7.00 0.29% |
| Unix | 752.00 3.84% |
632.00 4.70% |
120.00 1.96% |
570.00 3.64% |
87.00 6.50% |
206.00 5.53% |
469.00 4.00% |
28.00 1.17% |
| VT100 | 12.00 0.06% |
6.00 0.04% |
6.00 0.10% |
7.00 0.04% |
0.00 0.00% |
5.00 0.13% |
5.00 0.04% |
0.00 0.00% |
| Win95 | 9376.00 47.88% |
5969.00 44.37% |
3407.00 55.59% |
7489.00 47.77% |
559.00 41.75% |
1770.00 47.53% |
5515.00 46.99% |
1228.00 51.12% |
| Windows | 2309.00 11.79% |
1298.00 9.65% |
1011.00 16.50% |
1845.00 11.77% |
149.00 11.13% |
366.00 9.83% |
1342.00 11.43% |
400.00 16.65% |


GVU's WWW Surveying Team
Graphics, Visualization, & Usability Center
College of Computing
Georgia Institute of Technology
Atlanta, GA 30332-0280