
| Race | All | Male | Female | USA | Europe | 19-25 | 26-50 | 50+ |
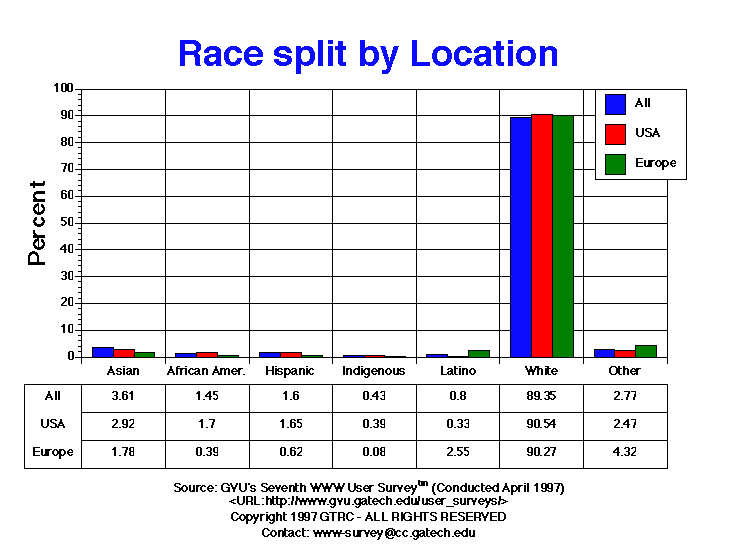
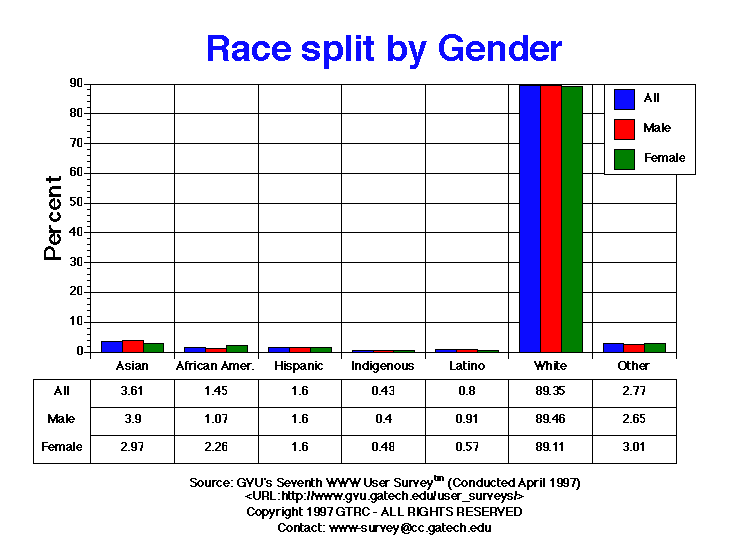
| Asian | 687.00 3.61% |
509.00 3.90% |
178.00 2.97% |
445.00 2.92% |
23.00 1.78% |
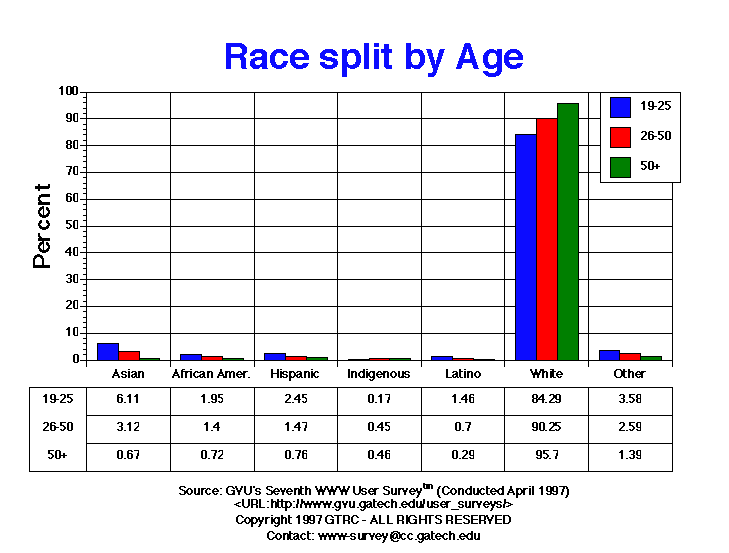
222.00 6.11% |
358.00 3.12% |
16.00 0.67% |
| African American | 275.00 1.45% |
140.00 1.07% |
135.00 2.26% |
259.00 1.70% |
5.00 0.39% |
71.00 1.95% |
161.00 1.40% |
17.00 0.72% |
| Hispanic | 305.00 1.60% |
209.00 1.60% |
96.00 1.60% |
251.00 1.65% |
8.00 0.62% |
89.00 2.45% |
169.00 1.47% |
18.00 0.76% |
| Indigenous | 81.00 0.43% |
52.00 0.40% |
29.00 0.48% |
60.00 0.39% |
1.00 0.08% |
6.00 0.17% |
52.00 0.45% |
11.00 0.46% |
| Latino | 152.00 0.80% |
118.00 0.91% |
34.00 0.57% |
50.00 0.33% |
33.00 2.55% |
53.00 1.46% |
80.00 0.70% |
7.00 0.29% |
| Other | 526.00 2.77% |
346.00 2.65% |
180.00 3.01% |
376.00 2.47% |
56.00 4.32% |
130.00 3.58% |
297.00 2.59% |
33.00 1.39% |
| White | 16995.00 89.35% |
11662.00 89.46% |
5333.00 89.11% |
13790.00 90.54% |
1169.00 90.27% |
3063.00 84.29% |
10343.00 90.25% |
2271.00 95.70% |


GVU's WWW Surveying Team
Graphics, Visualization, & Usability Center
College of Computing
Georgia Institute of Technology
Atlanta, GA 30332-0280