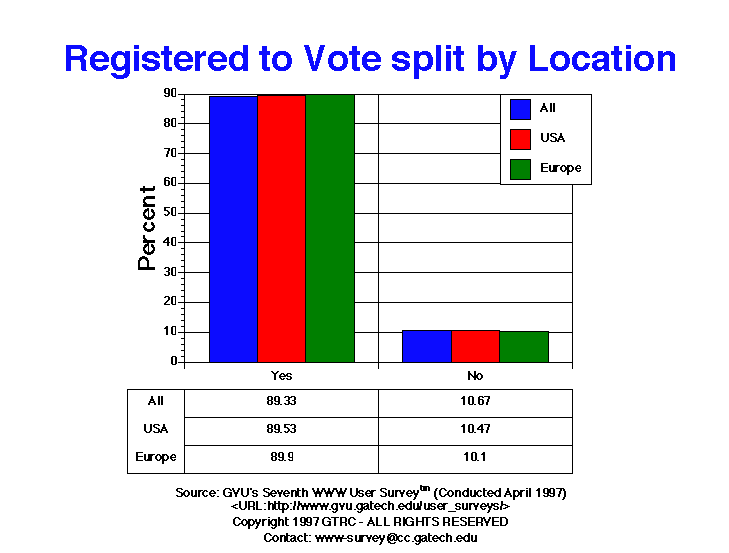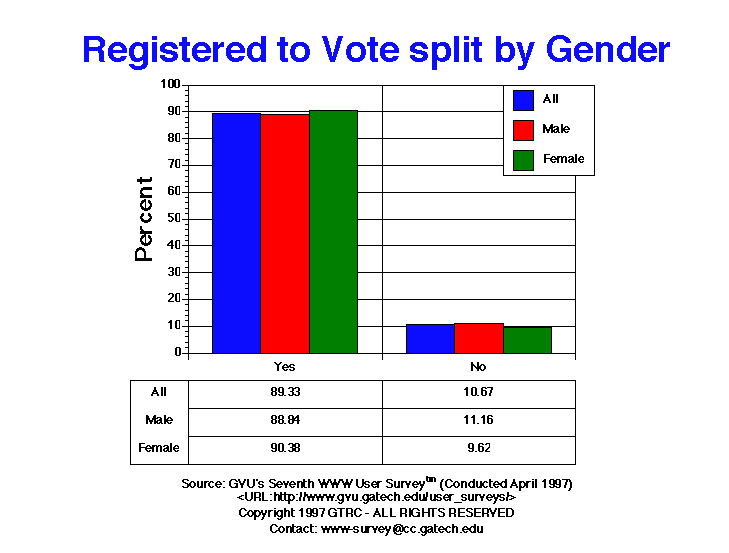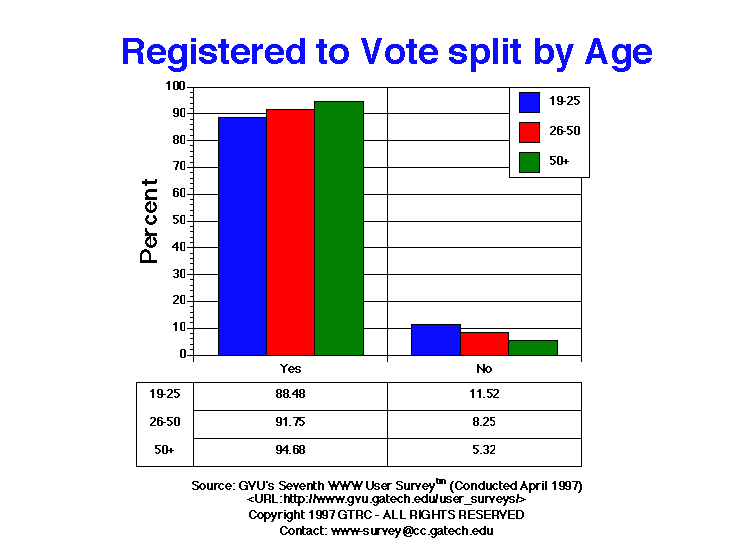

| Registered to Vote | All | Male | Female | USA | Europe | 19-25 | 26-50 | 50+ |
| No | 1941.00 10.67% |
1386.00 11.16% |
555.00 9.62% |
1560.00 10.47% |
109.00 10.10% |
407.00 11.52% |
919.00 8.25% |
124.00 5.32% |
| Yes | 16250.00 89.33% |
11038.00 88.84% |
5212.00 90.38% |
13335.00 89.53% |
970.00 89.90% |
3127.00 88.48% |
10226.00 91.75% |
2207.00 94.68% |


GVU's WWW Surveying Team
Graphics, Visualization, & Usability Center
College of Computing
Georgia Institute of Technology
Atlanta, GA 30332-0280