
| Sexual Preference | All | Male | Female | USA | Europe | 19-25 | 26-50 | 50+ |
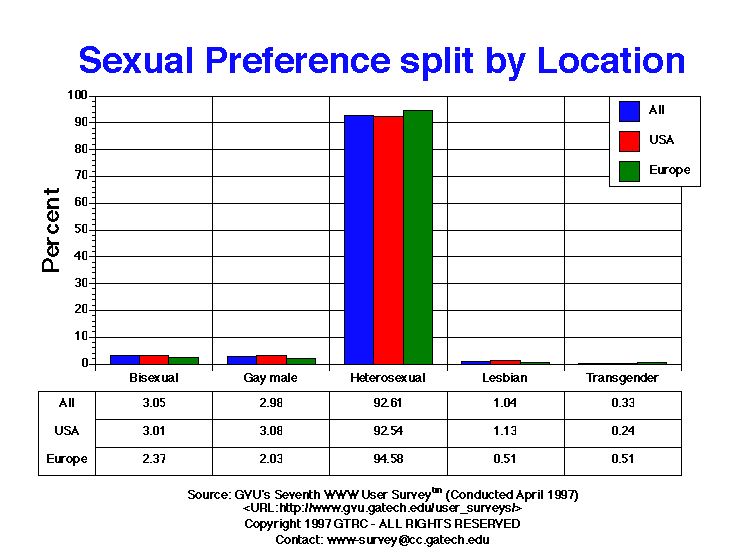
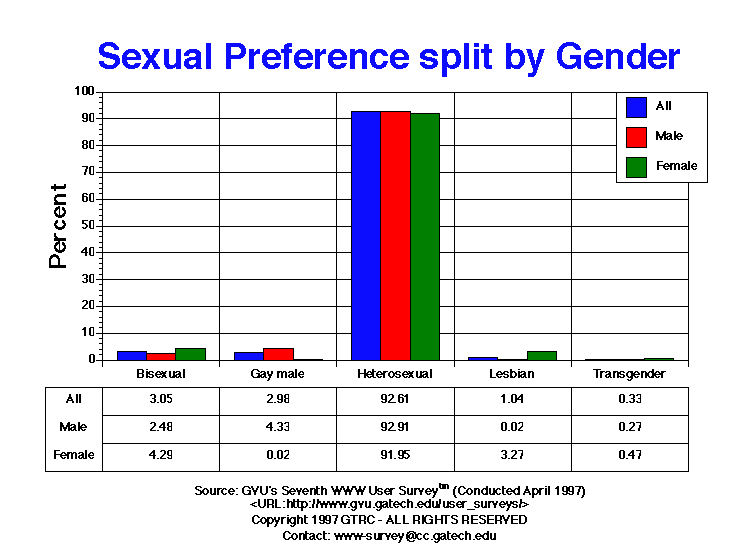
| Bisexual | 555.00 3.05% |
310.00 2.48% |
245.00 4.29% |
442.00 3.01% |
28.00 2.37% |
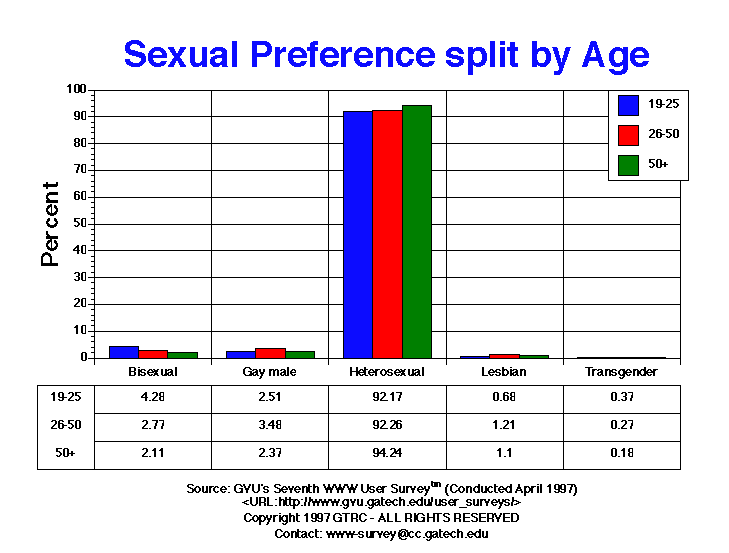
152.00 4.28% |
305.00 2.77% |
48.00 2.11% |
| Gay male | 542.00 2.98% |
541.00 4.33% |
1.00 0.02% |
453.00 3.08% |
24.00 2.03% |
89.00 2.51% |
383.00 3.48% |
54.00 2.37% |
| Heterosexual | 16869.00 92.61% |
11617.00 92.91% |
5252.00 91.95% |
13594.00 92.54% |
1117.00 94.58% |
3272.00 92.17% |
10147.00 92.26% |
2144.00 94.24% |
| Lesbian | 189.00 1.04% |
2.00 0.02% |
187.00 3.27% |
166.00 1.13% |
6.00 0.51% |
24.00 0.68% |
133.00 1.21% |
25.00 1.10% |
| Transgender | 61.00 0.33% |
34.00 0.27% |
27.00 0.47% |
35.00 0.24% |
6.00 0.51% |
13.00 0.37% |
30.00 0.27% |
4.00 0.18% |


GVU's WWW Surveying Team
Graphics, Visualization, & Usability Center
College of Computing
Georgia Institute of Technology
Atlanta, GA 30332-0280