
| Voting Behavior | All | Male | Female | USA | Europe | 19-25 | 26-50 | 50+ |
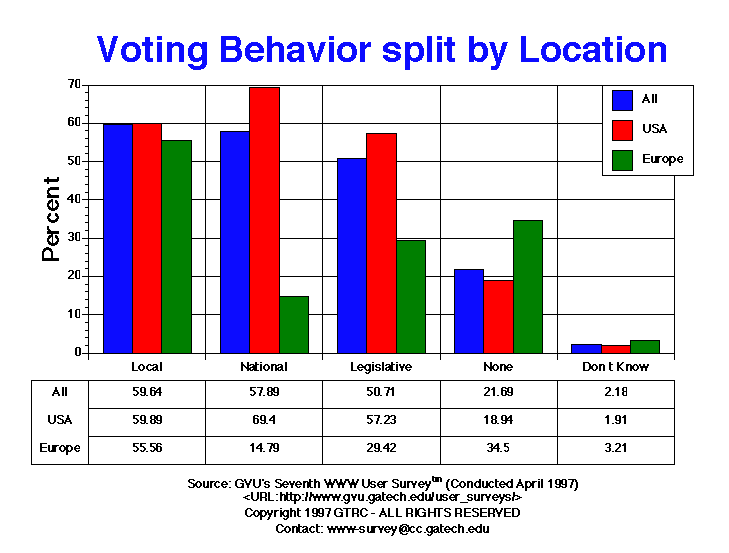
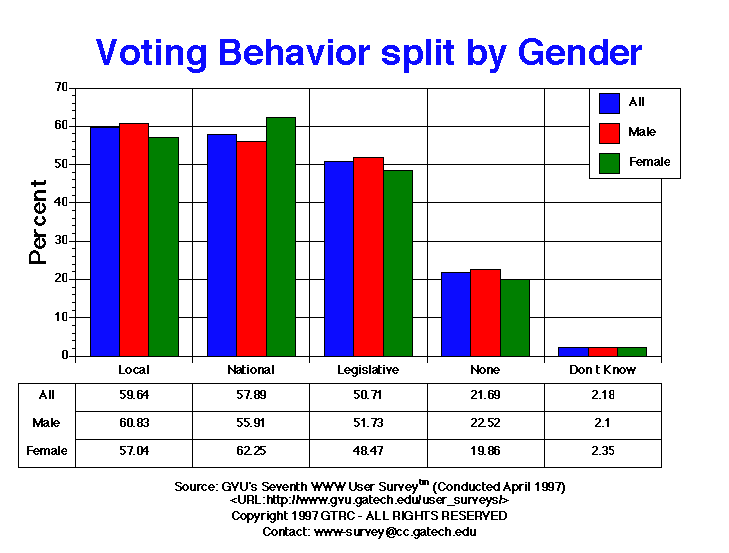
| Don t Know | 427.00 2.18% |
283.00 2.10% |
144.00 2.35% |
300.00 1.91% |
43.00 3.21% |
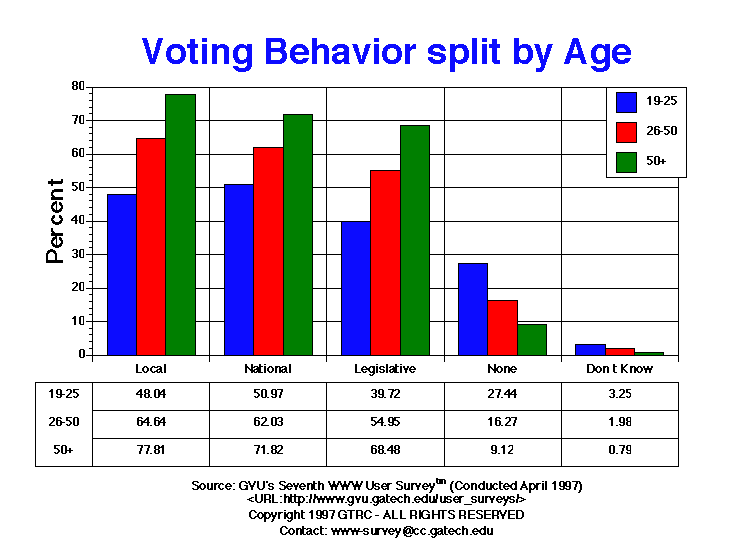
121.00 3.25% |
232.00 1.98% |
19.00 0.79% |
| Legislative | 9931.00 50.71% |
6960.00 51.73% |
2971.00 48.47% |
8971.00 57.23% |
394.00 29.42% |
1479.00 39.72% |
6450.00 54.95% |
1645.00 68.48% |
| Local | 11680.00 59.64% |
8184.00 60.83% |
3496.00 57.04% |
9389.00 59.89% |
744.00 55.56% |
1789.00 48.04% |
7587.00 64.64% |
1869.00 77.81% |
| National | 11337.00 57.89% |
7522.00 55.91% |
3815.00 62.25% |
10879.00 69.40% |
198.00 14.79% |
1898.00 50.97% |
7281.00 62.03% |
1725.00 71.82% |
| None | 4247.00 21.69% |
3030.00 22.52% |
1217.00 19.86% |
2969.00 18.94% |
462.00 34.50% |
1022.00 27.44% |
1910.00 16.27% |
219.00 9.12% |


GVU's WWW Surveying Team
Graphics, Visualization, & Usability Center
College of Computing
Georgia Institute of Technology
Atlanta, GA 30332-0280