
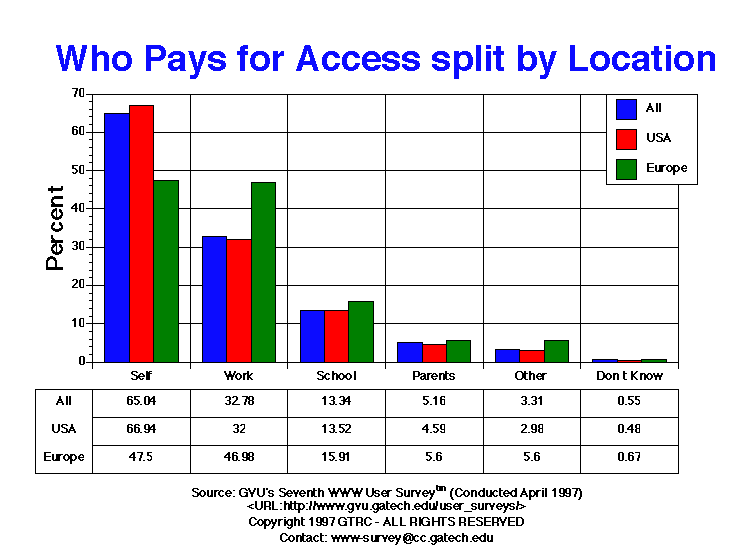
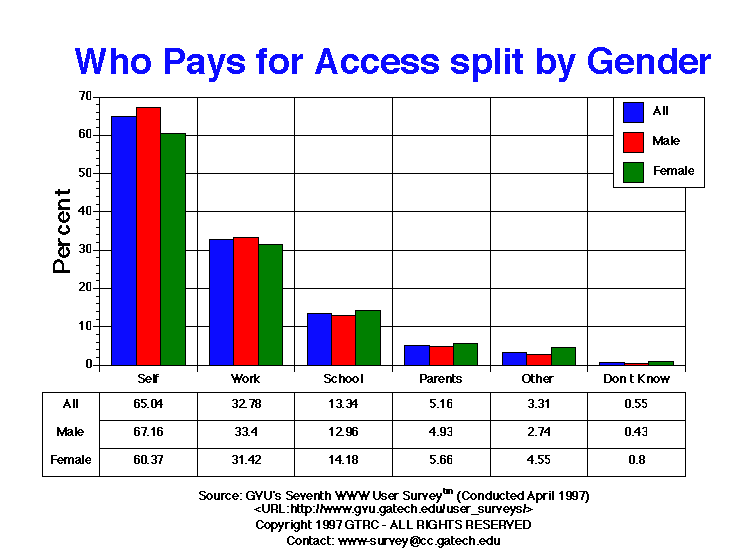
| Who Pays for Access | All | Male | Female | USA | Europe | 19-25 | 26-50 | 50+ |
| Don t Know | 107.00 0.55% |
58.00 0.43% |
49.00 0.80% |
76.00 0.48% |
9.00 0.67% |
17.00 0.46% |
44.00 0.37% |
9.00 0.37% |
| Other | 648.00 3.31% |
369.00 2.74% |
279.00 4.55% |
467.00 2.98% |
75.00 5.60% |
147.00 3.95% |
322.00 2.74% |
66.00 2.75% |
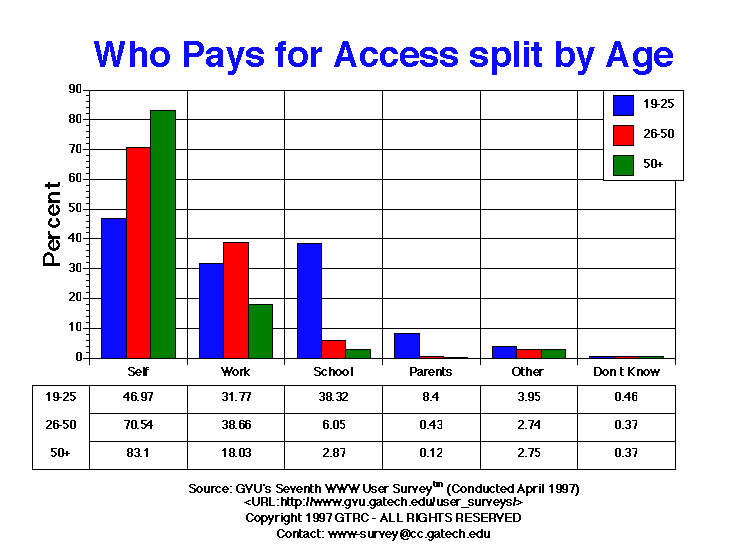
| Parents | 1010.00 5.16% |
663.00 4.93% |
347.00 5.66% |
719.00 4.59% |
75.00 5.60% |
313.00 8.40% |
51.00 0.43% |
3.00 0.12% |
| School | 2612.00 13.34% |
1743.00 12.96% |
869.00 14.18% |
2120.00 13.52% |
213.00 15.91% |
1427.00 38.32% |
710.00 6.05% |
69.00 2.87% |
| Self | 12736.00 65.04% |
9036.00 67.16% |
3700.00 60.37% |
10494.00 66.94% |
636.00 47.50% |
1749.00 46.97% |
8279.00 70.54% |
1996.00 83.10% |
| Work | 6419.00 32.78% |
4493.00 33.40% |
1926.00 31.42% |
5017.00 32.00% |
629.00 46.98% |
1183.00 31.77% |
4537.00 38.66% |
433.00 18.03% |
GVU's WWW Surveying Team
Graphics, Visualization, & Usability Center
College of Computing
Georgia Institute of Technology
Atlanta, GA 30332-0280