
Willingness to Pay Fees
Notes:
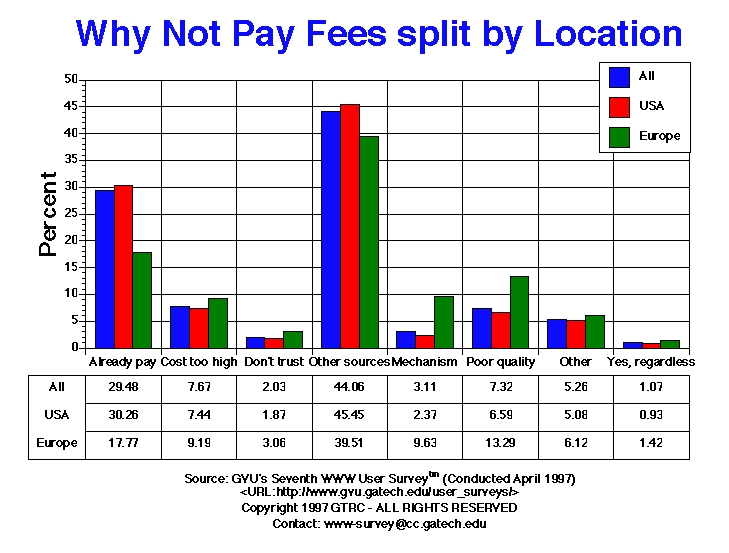
- In past surveys, we have asked whether people would be willing to pay fees to access sites. Typically, over 2/3 of the respondents claimed that they would not pay fees. In order to help figure out why, we repositioned this question to get at the reasons people would not pay to access Web sites. Almost half of the respondents cited being able to access the content on other sites as the main reason (44.06%). Next in line, people feel that they are already paying to access the Web via connectivity charges, so why should they pay to access specific sites (29.48%). Other popular reasons include costs too much to access (7.67%) and the content is of poor quality (7.32%). Only 1.07% state that they would pay regardless.
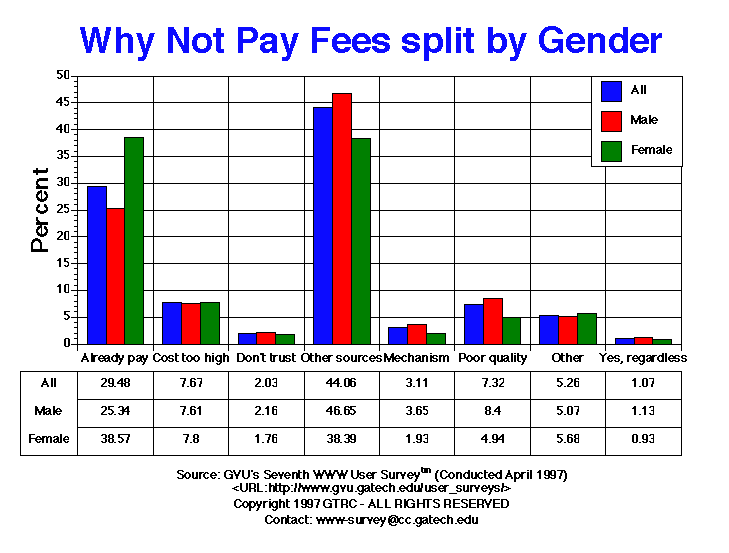
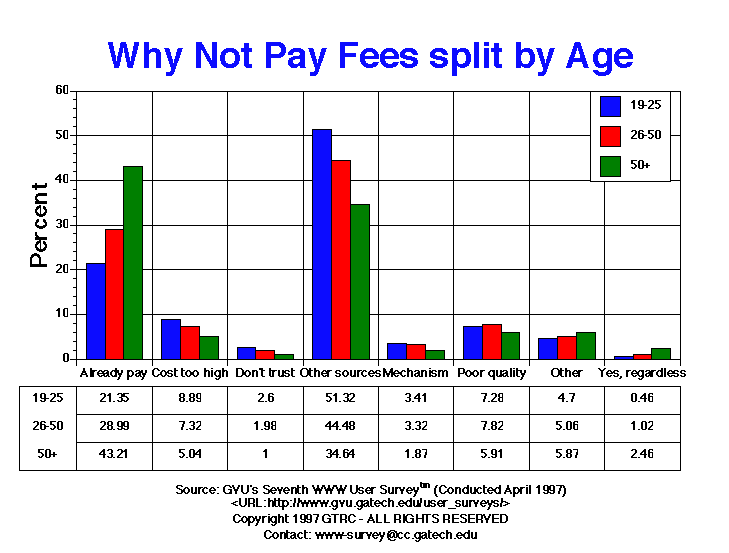
- European users are more concerned than their US counterparts about the poor quality and that there is no easy mechanism to pay for content. Women cite that they are already paying to access the Web as their main reason (38.57% female vs. 25.34% male) followed by the existence of other sources (38.39% female vs. 46.65% male). These are the only notable differences between gender on this question. The same effect of citing already paying as the main reason as opposed to being able to find other sources also occurs with age, where older users feel they are already paying and younger users feel they can find other sources of the same information.
Table of Data for All Categories
| Willingness to Pay Fees |
All |
Male |
Female |
USA |
Europe |
19-25 |
26-50 |
50+ |
| Already paying |
5773.00 29.48% |
3409.00 25.34% |
2364.00 38.57% |
4744.00 30.26% |
238.00 17.77% |
795.00 21.35% |
3403.00 28.99% |
1038.00 43.21% |
| Cost too high |
1502.00 7.67% |
1024.00 7.61% |
478.00 7.80% |
1167.00 7.44% |
123.00 9.19% |
331.00 8.89% |
859.00 7.32% |
121.00 5.04% |
| Don't trust |
398.00 2.03% |
290.00 2.16% |
108.00 1.76% |
293.00 1.87% |
41.00 3.06% |
97.00 2.60% |
232.00 1.98% |
24.00 1.00% |
| Other |
1030.00 5.26% |
682.00 5.07% |
348.00 5.68% |
797.00 5.08% |
82.00 6.12% |
175.00 4.70% |
594.00 5.06% |
141.00 5.87% |
| Other sources |
8629.00 44.06% |
6276.00 46.65% |
2353.00 38.39% |
7124.00 45.45% |
529.00 39.51% |
1911.00 51.32% |
5221.00 44.48% |
832.00 34.64% |
| Payment mechanism |
609.00 3.11% |
491.00 3.65% |
118.00 1.93% |
372.00 2.37% |
129.00 9.63% |
127.00 3.41% |
390.00 3.32% |
45.00 1.87% |
| Poor quality |
1433.00 7.32% |
1130.00 8.40% |
303.00 4.94% |
1033.00 6.59% |
178.00 13.29% |
271.00 7.28% |
918.00 7.82% |
142.00 5.91% |
| Yes, regardless |
209.00 1.07% |
152.00 1.13% |
57.00 0.93% |
146.00 0.93% |
19.00 1.42% |
17.00 0.46% |
120.00 1.02% |
59.00 2.46% |
For more information or to submit comments:
send e-mail to www-survey@cc.gatech.edu.
GVU's WWW Surveying Team
Graphics, Visualization, & Usability Center
College of Computing
Georgia Institute of Technology
Atlanta, GA 30332-0280