Years on Internet
Notes:
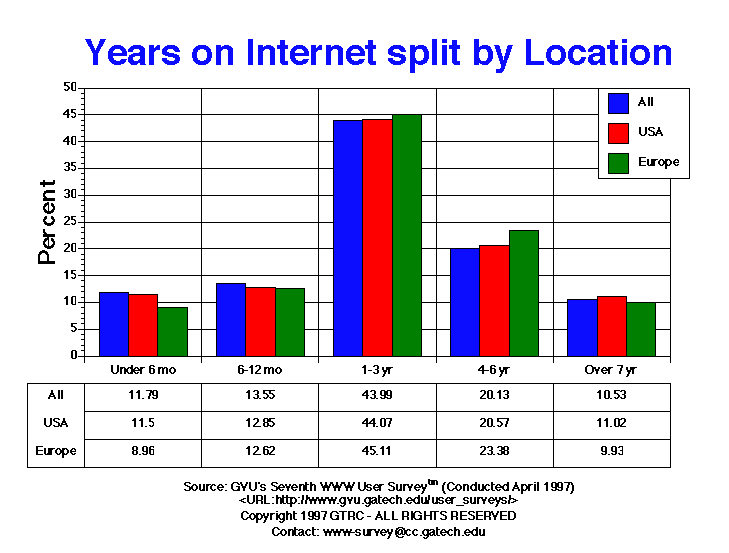
- The continued migration of users to the Internet is still seen in the Seventh Survey, where 25.34% of the users have gone online in the past year. Even though this represents one out of every four respondents, it is much less than the 36.11% observed in the Sixth Survey (October 1996), the 43.1% in the Fifth Survey (April 1996), 60.3% in the Fourth (Oct 1995), and 50.21% in the Third (April 1995). Close to half of the users have now been online between 1 and 3 years (43.99% Seventh vs. 42.44% Sixth). Nearly one in five users (20.13%) joined the Internet between April 1991 and April 1994, which represents a significant increase from the Sixth survey where only 14.31% of the users had been on the Internet between 4 and 6 years. Just over 10% of the users in the Seventh Survey have been on the Internet over 7 years, compared to 7.14% in the Sixth Survey.
- This longitudinal data shows the clear bump of when the Internet began to gain wide acceptance in 1994 and 1996. If we use the estimate of the number of Internet users in the US reported by FIND/SVP as 30 million, this translates to 8 million new users in the past year.
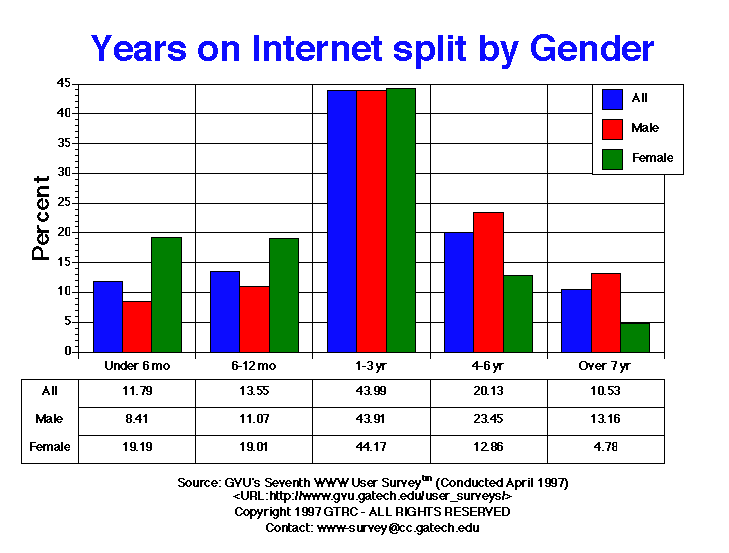
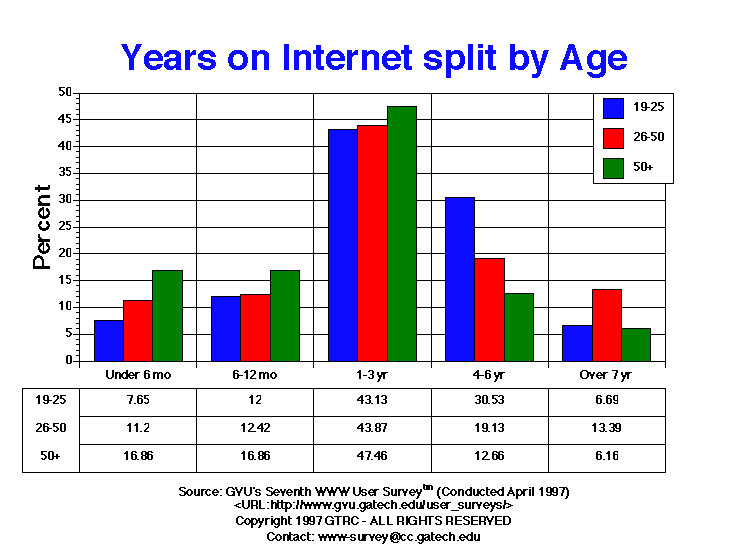
- Female users still are flocking to the Internet, with 38.20% having gone online in the past year, compared to only 19.48% for males. This is down significantly from the Sixth Survey in October 1996, where 50.35% of the female respondents and 29.60% of the male respondents went online in the past year. Females with under 6 months experience has declined to 19.19% from 27.65% in the Sixth Survey, 33.97% in the Fifth, 36.8% in the Fourth, and 39.5% in the Third Survey. The over 50 yr. old age group of users is also decreasing, with only 33.72% having gone online in the past year compared to 48.26% in the Sixth Survey and 55.86% in the Fifth Survey.
Table of Data for All Categories
| Years on Internet |
All |
Male |
Female |
USA |
Europe |
19-25 |
26-50 |
50+ |
| 1-3 yr |
8615.00 43.99% |
5908.00 43.91% |
2707.00 44.17% |
6908.00 44.07% |
604.00 45.11% |
1606.00 43.13% |
5149.00 43.87% |
1140.00 47.46% |
| 4-6 yr |
3943.00 20.13% |
3155.00 23.45% |
788.00 12.86% |
3225.00 20.57% |
313.00 23.38% |
1137.00 30.53% |
2245.00 19.13% |
304.00 12.66% |
| 6-12 mo |
2654.00 13.55% |
1489.00 11.07% |
1165.00 19.01% |
2014.00 12.85% |
169.00 12.62% |
447.00 12.00% |
1458.00 12.42% |
405.00 16.86% |
| Over 7 yr |
2063.00 10.53% |
1770.00 13.16% |
293.00 4.78% |
1727.00 11.02% |
133.00 9.93% |
249.00 6.69% |
1571.00 13.39% |
148.00 6.16% |
| Under 6 mo |
2308.00 11.79% |
1132.00 8.41% |
1176.00 19.19% |
1802.00 11.50% |
120.00 8.96% |
285.00 7.65% |
1314.00 11.20% |
405.00 16.86% |


For more information or to submit comments:
send e-mail to www-survey@cc.gatech.edu.
GVU's WWW Surveying Team
Graphics, Visualization, & Usability Center
College of Computing
Georgia Institute of Technology
Atlanta, GA 30332-0280


