
| Elected Officials Attitudes Toward People | All | Male | Female | USA | Europe | 19-25 | 26-50 | 50+ |
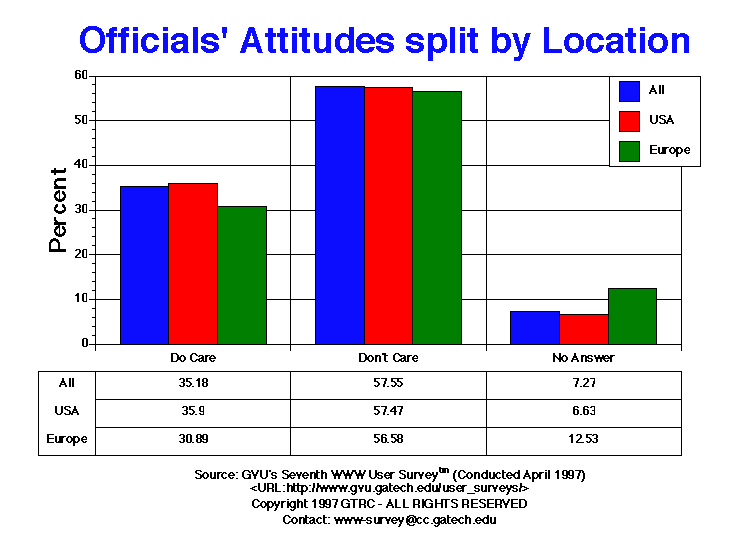
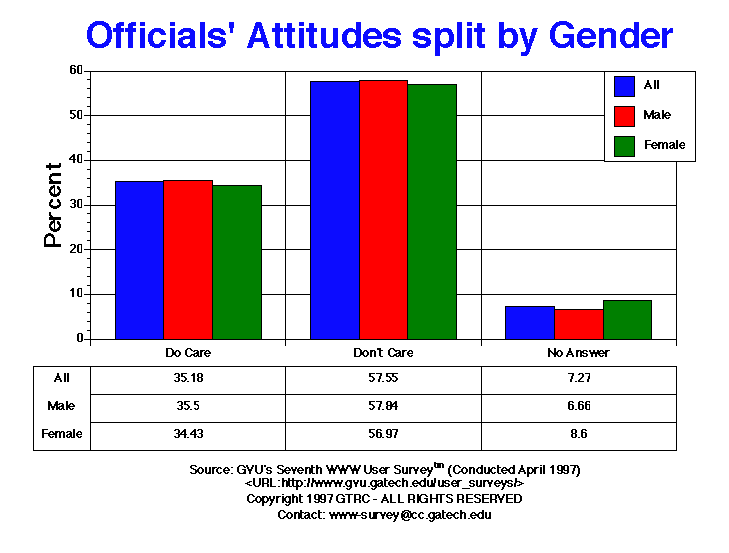
| Do Care | 4414.00 35.18% |
3006.00 35.50% |
1361.00 34.43% |
3606.00 35.90% |
249.00 30.89% |
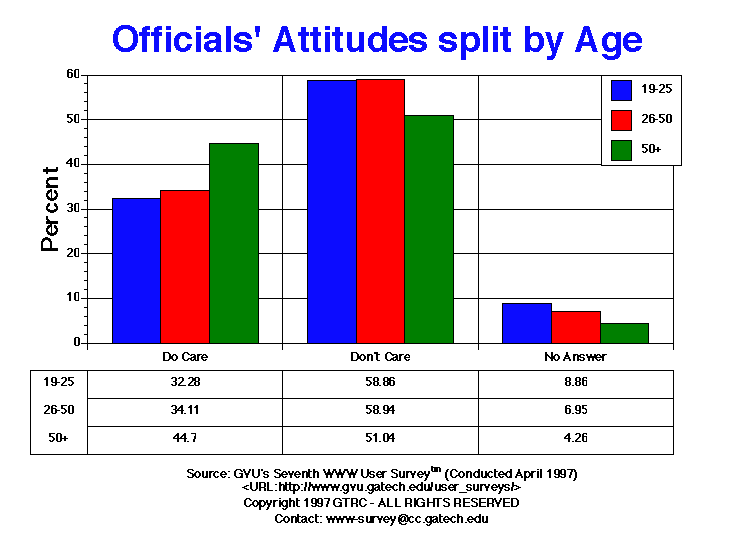
718.00 32.28% |
2573.00 34.11% |
797.00 44.70% |
| Don't Care | 7220.00 57.55% |
4898.00 57.84% |
2252.00 56.97% |
5773.00 57.47% |
456.00 56.58% |
1309.00 58.86% |
4446.00 58.94% |
910.00 51.04% |
| No Answer | 912.00 7.27% |
564.00 6.66% |
340.00 8.60% |
666.00 6.63% |
101.00 12.53% |
197.00 8.86% |
524.00 6.95% |
76.00 4.26% |


GVU's WWW Surveying Team
Graphics, Visualization, & Usability Center
College of Computing
Georgia Institute of Technology
Atlanta, GA 30332-0280