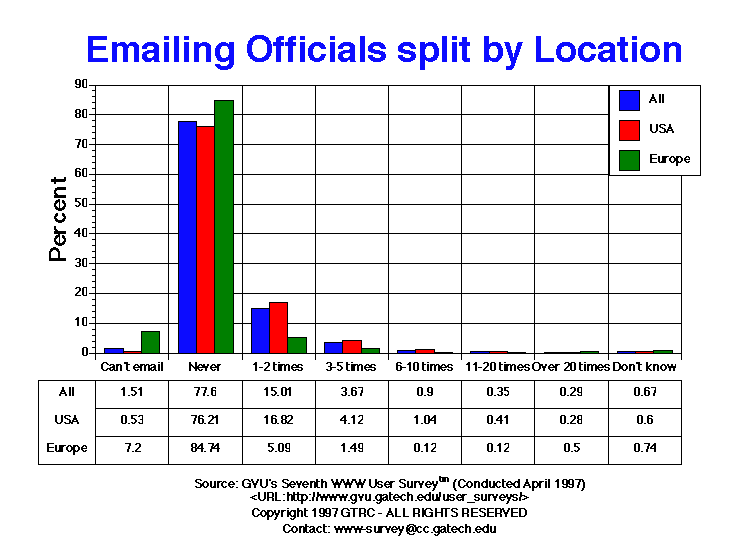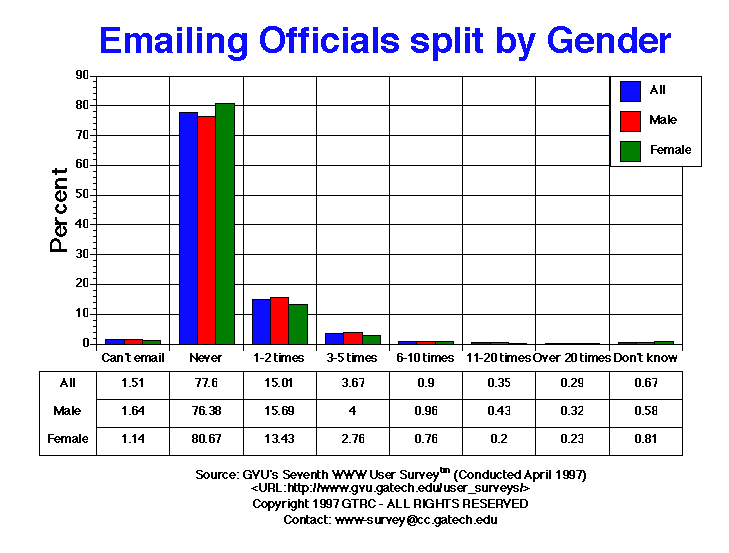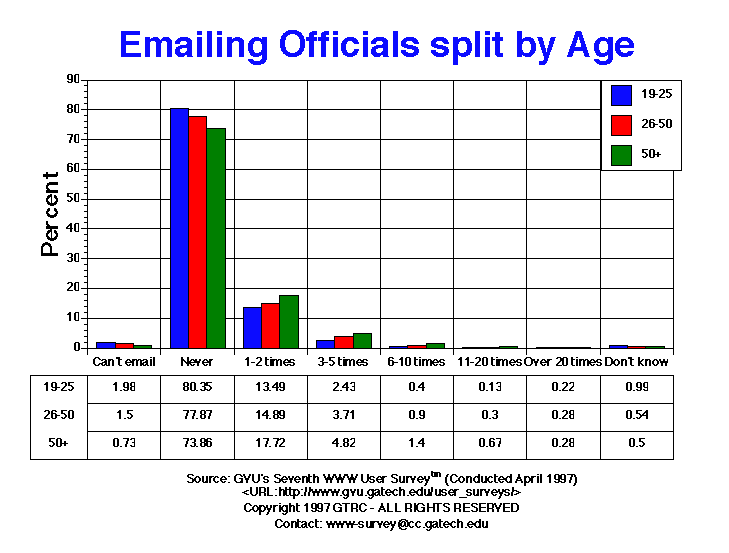

| Emailing Government Officials | All | Male | Female | USA | Europe | 19-25 | 26-50 | 50+ |
| 1-2 times | 1883.00 15.01% |
1329.00 15.69% |
531.00 13.43% |
1690.00 16.82% |
41.00 5.09% |
300.00 13.49% |
1123.00 14.89% |
316.00 17.72% |
| 11-20 times | 44.00 0.35% |
36.00 0.43% |
8.00 0.20% |
41.00 0.41% |
1.00 0.12% |
3.00 0.13% |
23.00 0.30% |
12.00 0.67% |
| 3-5 times | 460.00 3.67% |
339.00 4.00% |
109.00 2.76% |
414.00 4.12% |
12.00 1.49% |
54.00 2.43% |
280.00 3.71% |
86.00 4.82% |
| 6-10 times | 113.00 0.90% |
81.00 0.96% |
30.00 0.76% |
104.00 1.04% |
1.00 0.12% |
9.00 0.40% |
68.00 0.90% |
25.00 1.40% |
| Can't email | 189.00 1.51% |
139.00 1.64% |
45.00 1.14% |
53.00 0.53% |
58.00 7.20% |
44.00 1.98% |
113.00 1.50% |
13.00 0.73% |
| Don't know | 84.00 0.67% |
49.00 0.58% |
32.00 0.81% |
60.00 0.60% |
6.00 0.74% |
22.00 0.99% |
41.00 0.54% |
9.00 0.50% |
| Never | 9736.00 77.60% |
6468.00 76.38% |
3189.00 80.67% |
7655.00 76.21% |
683.00 84.74% |
1787.00 80.35% |
5874.00 77.87% |
1317.00 73.86% |
| Over 20 times | 37.00 0.29% |
27.00 0.32% |
9.00 0.23% |
28.00 0.28% |
4.00 0.50% |
5.00 0.22% |
21.00 0.28% |
5.00 0.28% |


GVU's WWW Surveying Team
Graphics, Visualization, & Usability Center
College of Computing
Georgia Institute of Technology
Atlanta, GA 30332-0280