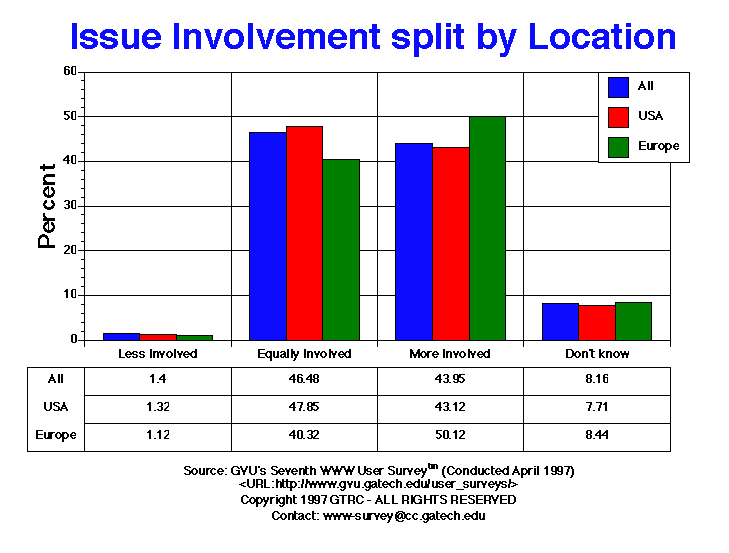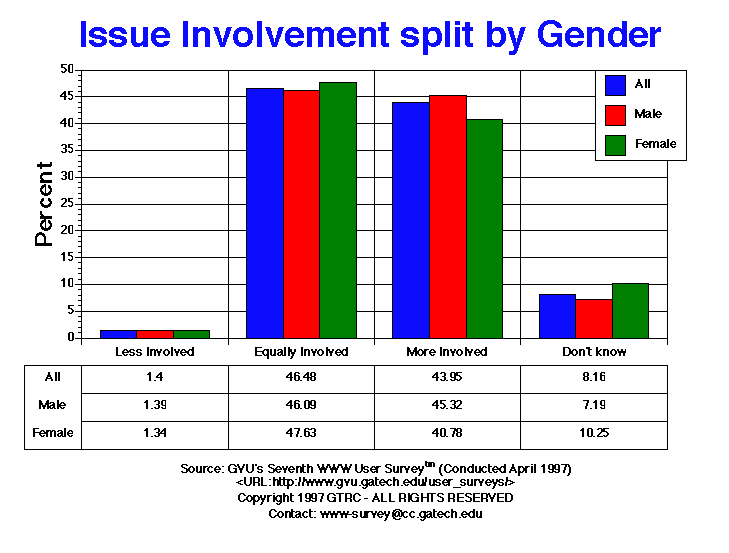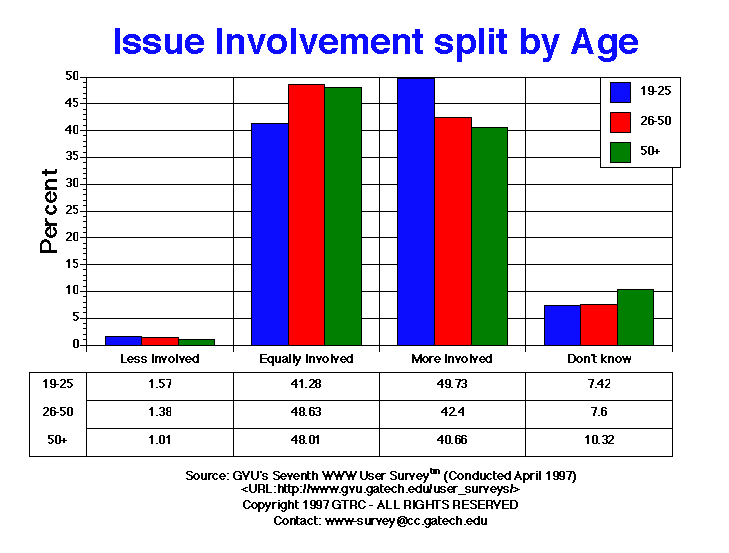

| Involvement with Issues | All | Male | Female | USA | Europe | 19-25 | 26-50 | 50+ |
| Don't know | 1024.00 8.16% |
609.00 7.19% |
405.00 10.25% |
774.00 7.71% |
68.00 8.44% |
165.00 7.42% |
573.00 7.60% |
184.00 10.32% |
| Equally Involved | 5832.00 46.48% |
3903.00 46.09% |
1883.00 47.63% |
4807.00 47.85% |
325.00 40.32% |
918.00 41.28% |
3668.00 48.63% |
856.00 48.01% |
| Less Involved | 176.00 1.40% |
118.00 1.39% |
53.00 1.34% |
133.00 1.32% |
9.00 1.12% |
35.00 1.57% |
104.00 1.38% |
18.00 1.01% |
| More Involved | 5514.00 43.95% |
3838.00 45.32% |
1612.00 40.78% |
4331.00 43.12% |
404.00 50.12% |
1106.00 49.73% |
3198.00 42.40% |
725.00 40.66% |


GVU's WWW Surveying Team
Graphics, Visualization, & Usability Center
College of Computing
Georgia Institute of Technology
Atlanta, GA 30332-0280