
| Online Political Activities | All | Male | Female | USA | Europe | 19-25 | 26-50 | 50+ |
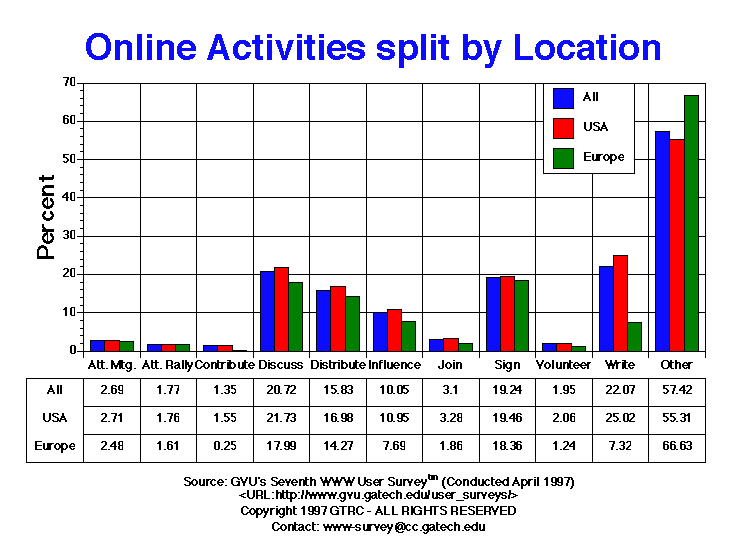
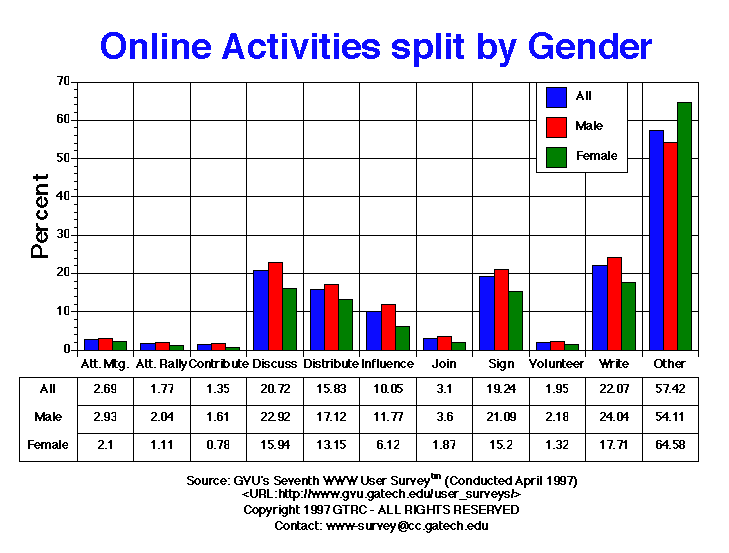
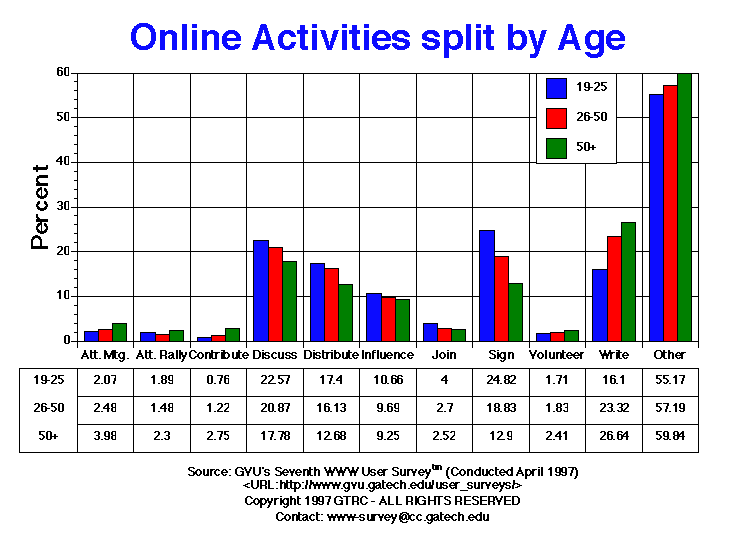
| Attend Meeting | 338.00 2.69% |
248.00 2.93% |
83.00 2.10% |
272.00 2.71% |
20.00 2.48% |
46.00 2.07% |
187.00 2.48% |
71.00 3.98% |
| Attend Rally | 222.00 1.77% |
173.00 2.04% |
44.00 1.11% |
177.00 1.76% |
13.00 1.61% |
42.00 1.89% |
112.00 1.48% |
41.00 2.30% |
| Contribute Money | 169.00 1.35% |
136.00 1.61% |
31.00 0.78% |
156.00 1.55% |
2.00 0.25% |
17.00 0.76% |
92.00 1.22% |
49.00 2.75% |
| Discuss Issues | 2600.00 20.72% |
1941.00 22.92% |
630.00 15.94% |
2183.00 21.73% |
145.00 17.99% |
502.00 22.57% |
1574.00 20.87% |
317.00 17.78% |
| Distribute Information | 1986.00 15.83% |
1450.00 17.12% |
520.00 13.15% |
1706.00 16.98% |
115.00 14.27% |
387.00 17.40% |
1217.00 16.13% |
226.00 12.68% |
| Influence Others | 1261.00 10.05% |
997.00 11.77% |
242.00 6.12% |
1100.00 10.95% |
62.00 7.69% |
237.00 10.66% |
731.00 9.69% |
165.00 9.25% |
| Join Group | 389.00 3.10% |
305.00 3.60% |
74.00 1.87% |
329.00 3.28% |
15.00 1.86% |
89.00 4.00% |
204.00 2.70% |
45.00 2.52% |
| Other | 7204.00 57.42% |
4582.00 54.11% |
2553.00 64.58% |
5556.00 55.31% |
537.00 66.63% |
1227.00 55.17% |
4314.00 57.19% |
1067.00 59.84% |
| Sign Petition | 2414.00 19.24% |
1786.00 21.09% |
601.00 15.20% |
1955.00 19.46% |
148.00 18.36% |
552.00 24.82% |
1420.00 18.83% |
230.00 12.90% |
| Volunteer | 245.00 1.95% |
185.00 2.18% |
52.00 1.32% |
207.00 2.06% |
10.00 1.24% |
38.00 1.71% |
138.00 1.83% |
43.00 2.41% |
| Write Official | 2769.00 22.07% |
2036.00 24.04% |
700.00 17.71% |
2513.00 25.02% |
59.00 7.32% |
358.00 16.10% |
1759.00 23.32% |
475.00 26.64% |


GVU's WWW Surveying Team
Graphics, Visualization, & Usability Center
College of Computing
Georgia Institute of Technology
Atlanta, GA 30332-0280