
| Use of Electronic White House Documents | All | Male | Female | USA | Europe | 19-25 | 26-50 | 50+ |
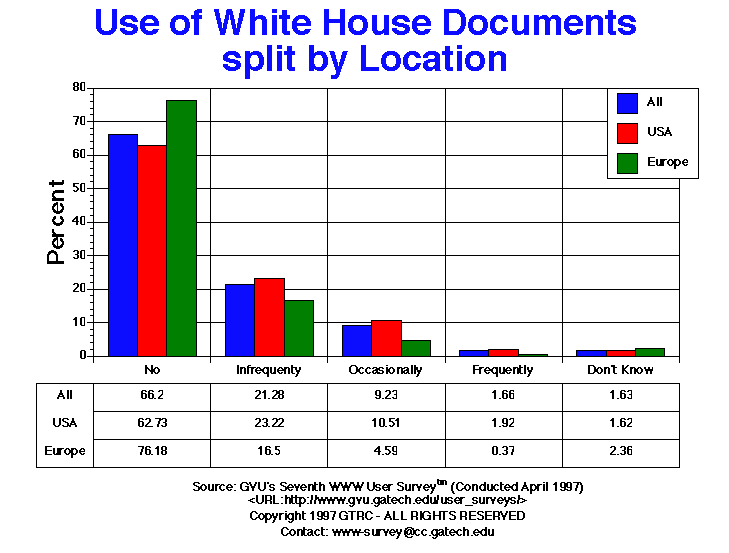
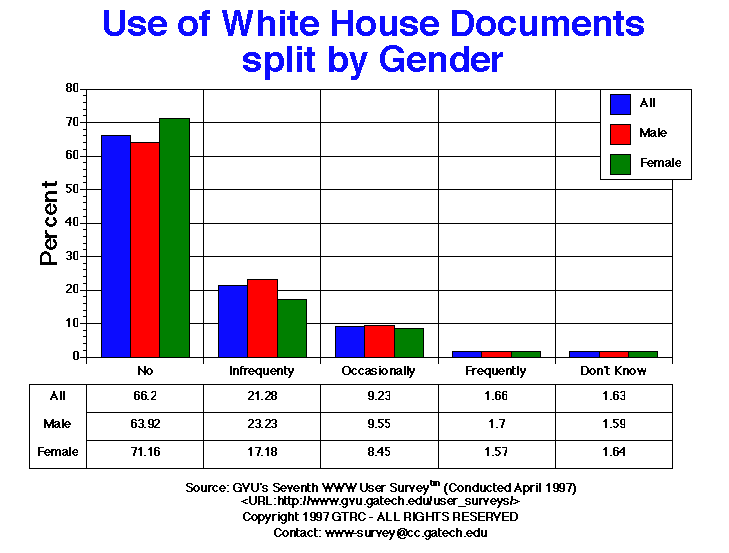
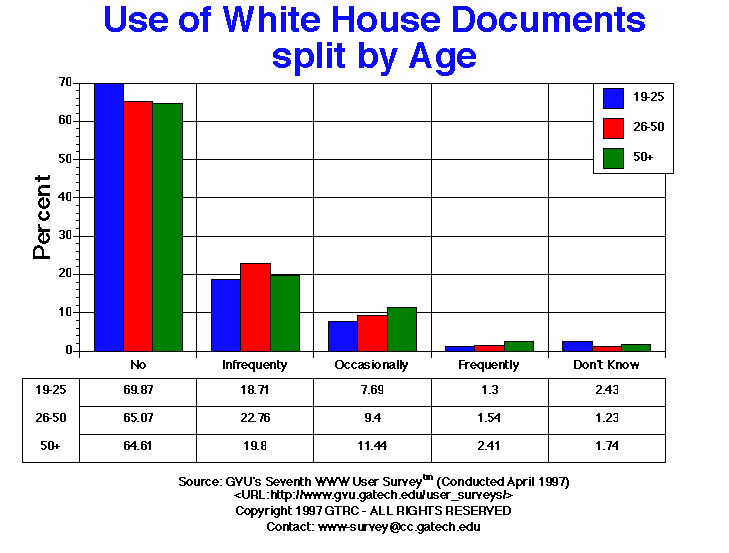
| Don't Know | 205.00 1.63% |
135.00 1.59% |
65.00 1.64% |
163.00 1.62% |
19.00 2.36% |
54.00 2.43% |
93.00 1.23% |
31.00 1.74% |
| Frequently | 208.00 1.66% |
144.00 1.70% |
62.00 1.57% |
193.00 1.92% |
3.00 0.37% |
29.00 1.30% |
116.00 1.54% |
43.00 2.41% |
| Infrequently | 2670.00 21.28% |
1967.00 23.23% |
679.00 17.18% |
2332.00 23.22% |
133.00 16.50% |
416.00 18.71% |
1717.00 22.76% |
353.00 19.80% |
| No | 8305.00 66.20% |
5413.00 63.92% |
2813.00 71.16% |
6301.00 62.73% |
614.00 76.18% |
1554.00 69.87% |
4908.00 65.07% |
1152.00 64.61% |
| Occasionally | 1158.00 9.23% |
809.00 9.55% |
334.00 8.45% |
1056.00 10.51% |
37.00 4.59% |
171.00 7.69% |
709.00 9.40% |
204.00 11.44% |
GVU's WWW Surveying Team
Graphics, Visualization, & Usability Center
College of Computing
Georgia Institute of Technology
Atlanta, GA 30332-0280