Attitudes Towards Spamming
Notes:
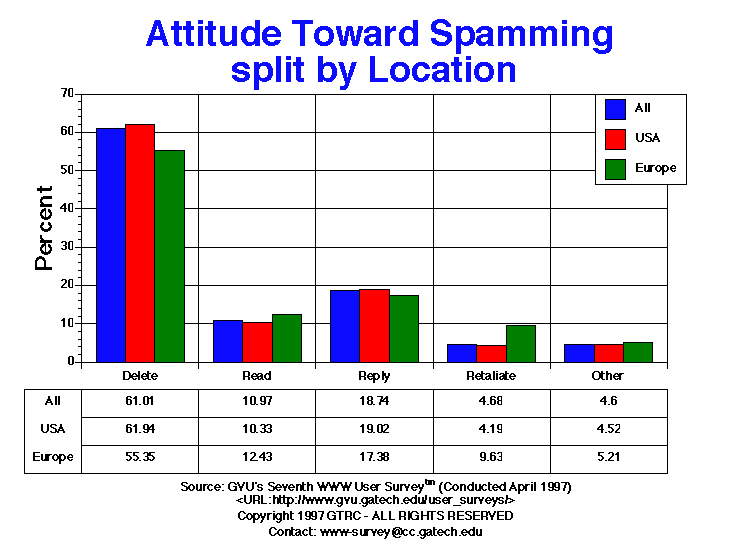
- How exactly do people deal with unsolicited mass emailings (a.k.a. SPAM)? Out of those users who report receiving mass emailings, the most popular response to being spammed is to simply delete the message (61.01%). Nearly
one in five users (18.74%) respond to the entities behind the email requesting to be removed from future mailings. Only 10.97% report actually reading the message (up slightly from the Sixth survey of 9.88%), a number which may suprise those entities that send the messages. Close to 5% of the people claim to retaliate in one form or another (mail bombs, denial-of-service attacks, etc.), up one percentage point from the Sixth Survey.
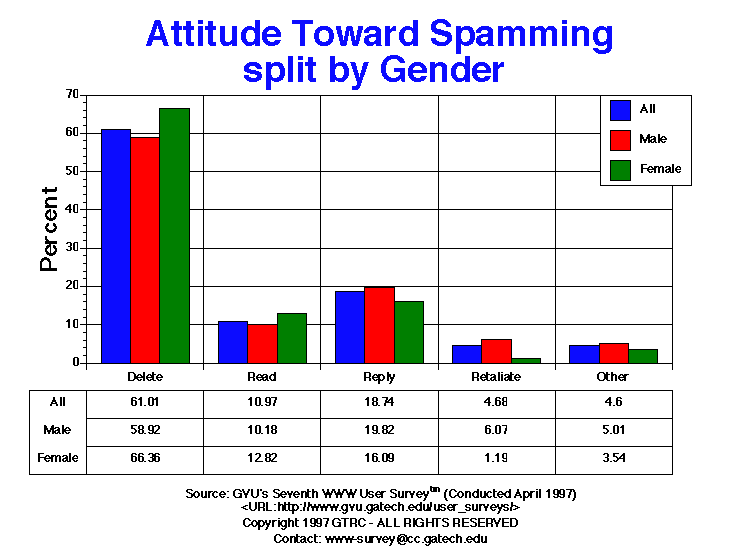
- As with the Sixth Survey, nearly twice as many Europeans retaliate when spammed (9.63%). Gender differences also exist, with women being less likely to retaliate (1.19% female vs. 6.07% male) and more likely to delete the
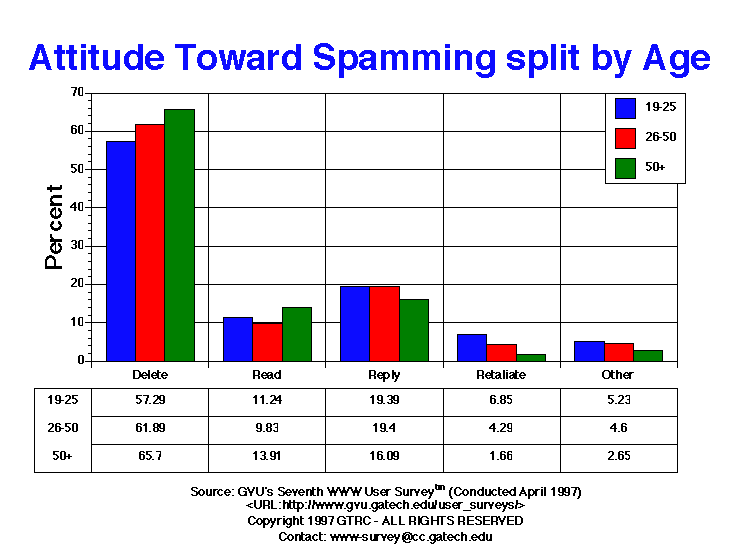
message. As one might expect, the elder generation deletes more spam and retaliates less than the younger generation (65.70% 50+ delete vs. 57.29% 19-25 and 1.66% 50+ retaliate vs. 6.85% 19-25). This trend towards lack of acceptance of spamming among the younger generations does not paint a nice picture for the future of spammers, though they may decide to direct more mass emailings towards the older, more tolerant audiences.
Table of Data for All Categories
| Attitudes Towards Spamming |
All |
Male |
Female |
USA |
Europe |
19-25 |
26-50 |
50+ |
| Delete |
7199.00 61.01% |
4908.00 58.92% |
2231.00 66.36% |
5901.00 61.94% |
414.00 55.35% |
1238.00 57.29% |
4428.00 61.89% |
992.00 65.70% |
| Other |
543.00 4.60% |
417.00 5.01% |
119.00 3.54% |
431.00 4.52% |
39.00 5.21% |
113.00 5.23% |
329.00 4.60% |
40.00 2.65% |
| Read |
1294.00 10.97% |
848.00 10.18% |
431.00 12.82% |
984.00 10.33% |
93.00 12.43% |
243.00 11.24% |
703.00 9.83% |
210.00 13.91% |
| Reply |
2211.00 18.74% |
1651.00 19.82% |
541.00 16.09% |
1812.00 19.02% |
130.00 17.38% |
419.00 19.39% |
1388.00 19.40% |
243.00 16.09% |
| Retaliate |
552.00 4.68% |
506.00 6.07% |
40.00 1.19% |
399.00 4.19% |
72.00 9.63% |
148.00 6.85% |
307.00 4.29% |
25.00 1.66% |


For more information or to submit comments:
send e-mail to www-survey@cc.gatech.edu.
GVU's WWW Surveying Team
Graphics, Visualization, & Usability Center
College of Computing
Georgia Institute of Technology
Atlanta, GA 30332-0280


