
Reasons for Not Registering
Notes:
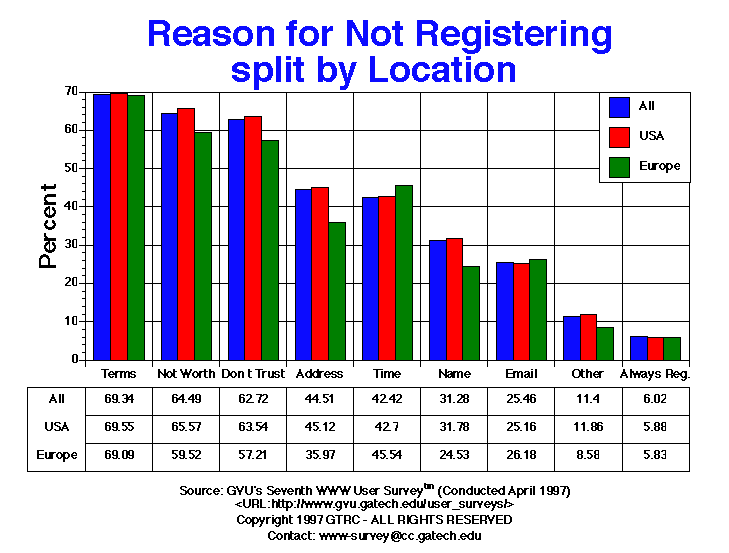
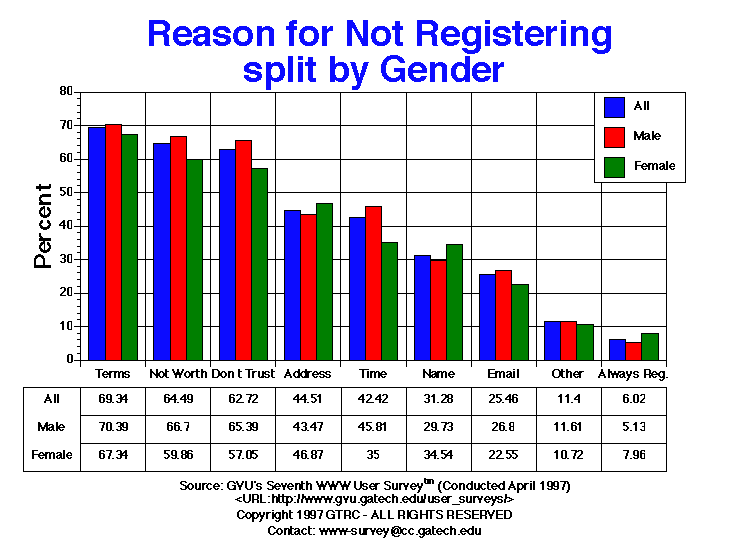
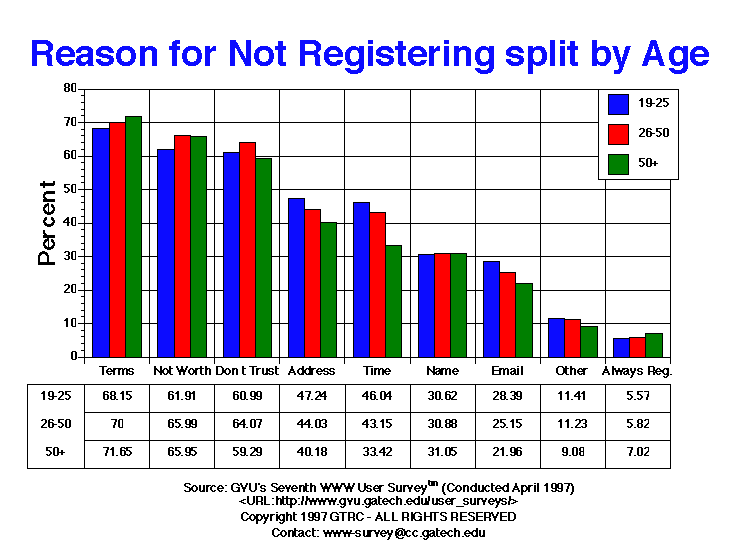
- From this Survey and the Sixth Survey, it has been established that people falsify information of online registrations with some regularity and that online community very seriously values it's anonymity. This question attempt to understand why people resist online registration. The most widely cited reason for not registering is that the terms and conditions of how the collected information is going to be used is not clearly specified (69.34%). Users also feel very strongly that revealing the requested information is not worth being able to access the site (64.49%). Thus, while the foremost problem of terms and conditions of user can be easily rectified, the latter
problem of making the trade-off between demographic collected and accessing a site is not as straight forward (we address this issue of possible solutions in Terms
and Conditions for Revealing Demographic Information). An equally difficult issue is building trust between entities. Over 62% report that they do not trust the collecting sites. Efforts that attempt to help ensure the data privacy standards of sites, like E-Trust may be able to help alleviate this lack of trust.
- As with the Sixth Survey, the time it takes to complete the form is a factor (42.42%), but not as significant as the others. Much of the remaining difficulties reside in the type of information collected, with 44.51% not registering because of postal mail address requirements, 31.28% because of name requirements, and 25.46% email requirements. Thus, proposals that call for business cards to be built into browsers and protocol which would enable them to be easily deposited at sites is probably not the cure-all for this problem but ought to help. The overall ranking of reasons for not registering and the percentages are consistent with the findings from the Sixth Survey.
Table of Data for All Categories
| Reasons for Not Registering |
All |
Male |
Female |
USA |
Europe |
19-25 |
26-50 |
50+ |
| Always Register |
844.00 6.02% |
486.00 5.13% |
351.00 7.96% |
659.00 5.88% |
53.00 5.83% |
140.00 5.57% |
490.00 5.82% |
133.00 7.02% |
| Don t Trust |
8790.00 62.72% |
6198.00 65.39% |
2517.00 57.05% |
7115.00 63.54% |
520.00 57.21% |
1534.00 60.99% |
5396.00 64.07% |
1123.00 59.29% |
| Not Worth Risk |
9038.00 64.49% |
6322.00 66.70% |
2641.00 59.86% |
7342.00 65.57% |
541.00 59.52% |
1557.00 61.91% |
5558.00 65.99% |
1249.00 65.95% |
| Other |
1597.00 11.40% |
1100.00 11.61% |
473.00 10.72% |
1328.00 11.86% |
78.00 8.58% |
287.00 11.41% |
946.00 11.23% |
172.00 9.08% |
| Requires Address |
6238.00 44.51% |
4120.00 43.47% |
2068.00 46.87% |
5053.00 45.12% |
327.00 35.97% |
1188.00 47.24% |
3708.00 44.03% |
761.00 40.18% |
| Requires Email |
3568.00 25.46% |
2540.00 26.80% |
995.00 22.55% |
2817.00 25.16% |
238.00 26.18% |
714.00 28.39% |
2118.00 25.15% |
416.00 21.96% |
| Requires Name |
4383.00 31.28% |
2818.00 29.73% |
1524.00 34.54% |
3559.00 31.78% |
223.00 24.53% |
770.00 30.62% |
2601.00 30.88% |
588.00 31.05% |
| Terms |
9718.00 69.34% |
6672.00 70.39% |
2971.00 67.34% |
7788.00 69.55% |
628.00 69.09% |
1714.00 68.15% |
5895.00 70.00% |
1357.00 71.65% |
| Time |
5945.00 42.42% |
4342.00 45.81% |
1544.00 35.00% |
4781.00 42.70% |
414.00 45.54% |
1158.00 46.04% |
3634.00 43.15% |
633.00 33.42% |
For more information or to submit comments:
send e-mail to www-survey@cc.gatech.edu.
GVU's WWW Surveying Team
Graphics, Visualization, & Usability Center
College of Computing
Georgia Institute of Technology
Atlanta, GA 30332-0280