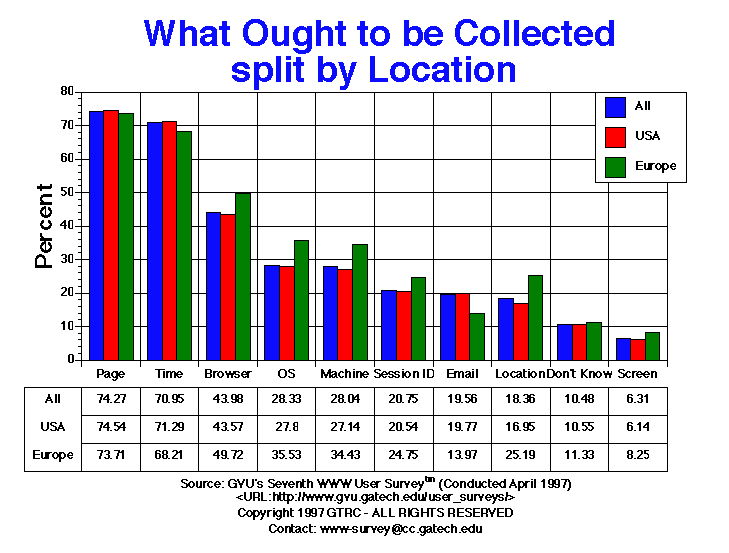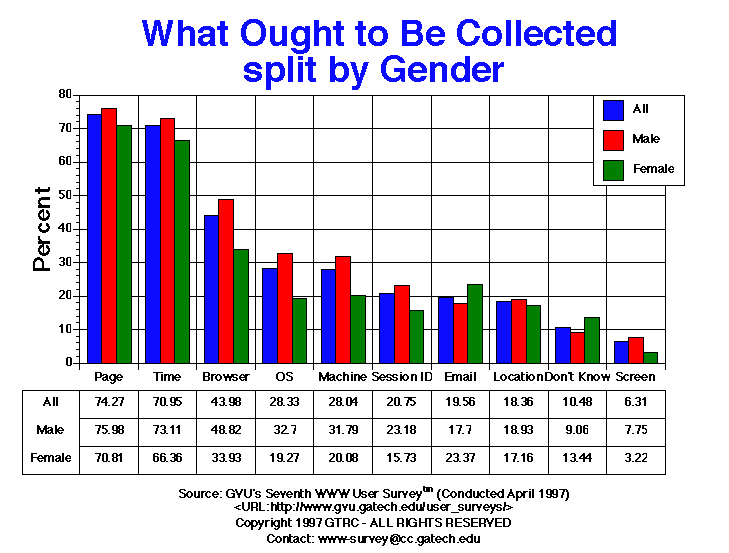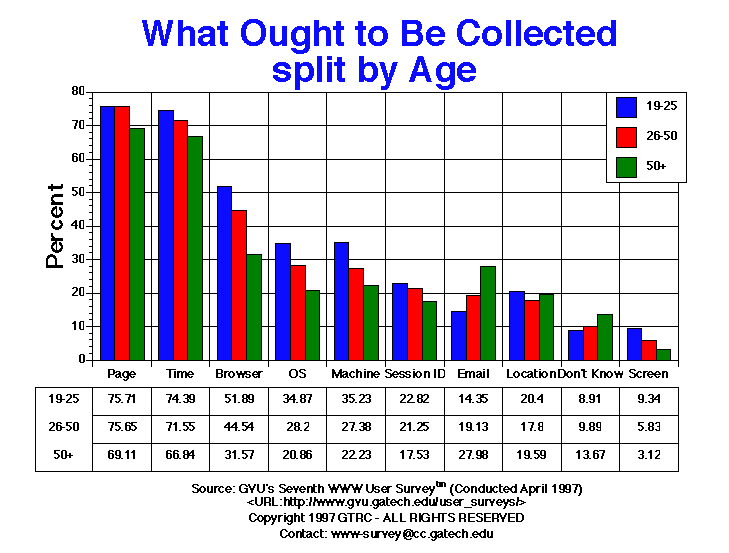

| What Information Ought to be Collected per Page Request | All | Male | Female | USA | Europe | 19-25 | 26-50 | 50+ |
| Don t Know | 1468.00 10.48% |
859.00 9.06% |
593.00 13.44% |
1181.00 10.55% |
103.00 11.33% |
224.00 8.91% |
833.00 9.89% |
259.00 13.67% |
| Email Address | 2741.00 19.56% |
1678.00 17.70% |
1031.00 23.37% |
2214.00 19.77% |
127.00 13.97% |
361.00 14.35% |
1611.00 19.13% |
530.00 27.98% |
| Location | 2573.00 18.36% |
1794.00 18.93% |
757.00 17.16% |
1898.00 16.95% |
229.00 25.19% |
513.00 20.40% |
1499.00 17.80% |
371.00 19.59% |
| Machine | 3929.00 28.04% |
3013.00 31.79% |
886.00 20.08% |
3039.00 27.14% |
313.00 34.43% |
886.00 35.23% |
2306.00 27.38% |
421.00 22.23% |
| OS | 3970.00 28.33% |
3099.00 32.70% |
850.00 19.27% |
3113.00 27.80% |
323.00 35.53% |
877.00 34.87% |
2375.00 28.20% |
395.00 20.86% |
| Requested Page | 10408.00 74.27% |
7201.00 75.98% |
3124.00 70.81% |
8347.00 74.54% |
670.00 73.71% |
1904.00 75.71% |
6371.00 75.65% |
1309.00 69.11% |
| Screen Size | 884.00 6.31% |
735.00 7.75% |
142.00 3.22% |
688.00 6.14% |
75.00 8.25% |
235.00 9.34% |
491.00 5.83% |
59.00 3.12% |
| Session ID | 2908.00 20.75% |
2197.00 23.18% |
694.00 15.73% |
2300.00 20.54% |
225.00 24.75% |
574.00 22.82% |
1790.00 21.25% |
332.00 17.53% |
| Time of Request | 9943.00 70.95% |
6929.00 73.11% |
2928.00 66.36% |
7983.00 71.29% |
620.00 68.21% |
1871.00 74.39% |
6026.00 71.55% |
1266.00 66.84% |
| Which Browser | 6163.00 43.98% |
4627.00 48.82% |
1497.00 33.93% |
4879.00 43.57% |
452.00 49.72% |
1305.00 51.89% |
3751.00 44.54% |
598.00 31.57% |


GVU's WWW Surveying Team
Graphics, Visualization, & Usability Center
College of Computing
Georgia Institute of Technology
Atlanta, GA 30332-0280