Browsing Strategies
Notes:
- For this question, users were asked what strategies they use when browsing the Web. Favorite/Bookmark (users
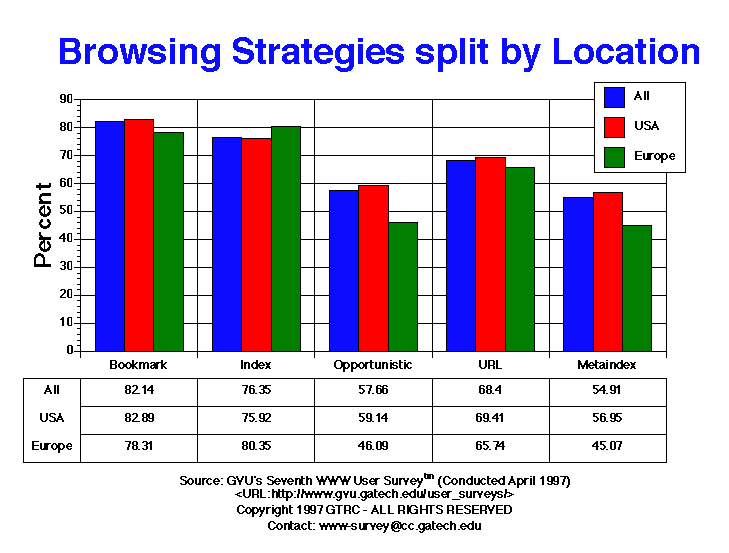
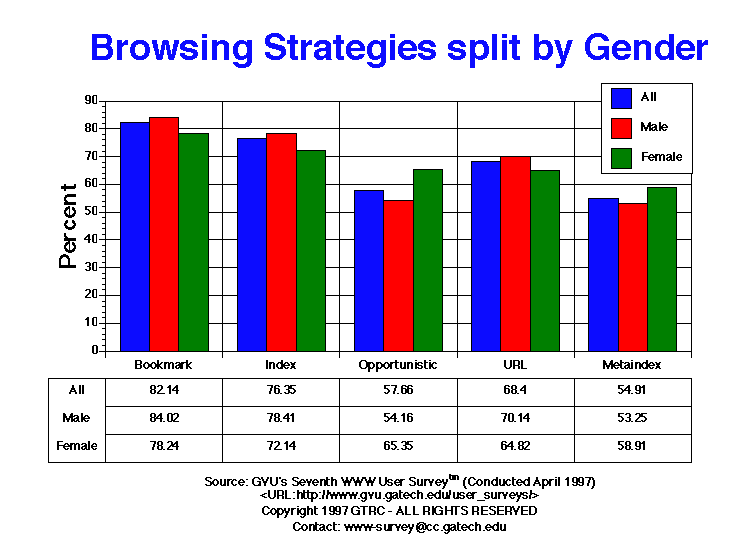
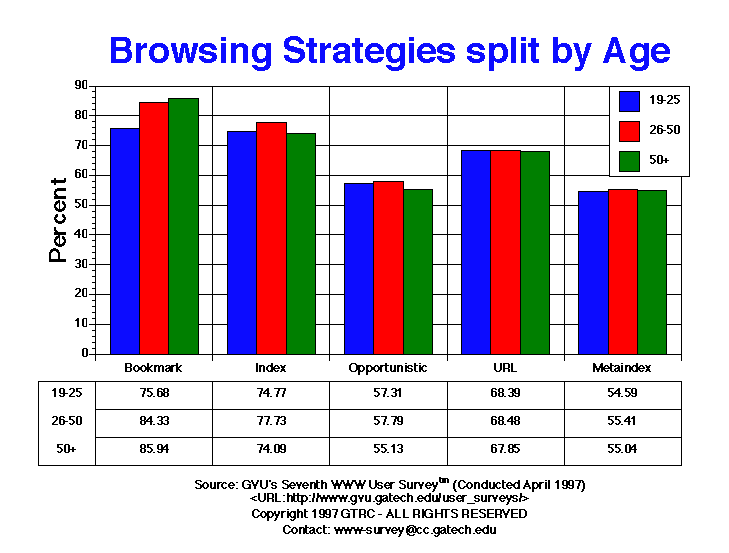
revisiting pages they have added to their favorite/bookmark), Index (using search engines such as Lycos), Meta-index (using large indices such as Yahoo), Opportunistic (following links from page to page as they are encountered), and URL (typing in known URLs). For this question, users were allowed to mark more than one answer. Once again, all categories had very high percentages. As in the Fourth, Fifth, and Sixth Survey, the highest was Bookmarks
(82.14% Seventh vs. 82.69% Sixth), followed by Index (76.35% Seventh vs. 78.1%Sixth) and URL (68.40% Seventh vs.
69.44% Sixth). The percentages for Meta-indices (54.91%), Opportunistic (57.66%) and URL based (68.40%) strategies have dropped somewhat since the Sixth and Fifth Survey. As with the Sixth Survey, younger users are less likely to use bookmarks (75.68% 19-25 vs. 85.94% 50+), though differences for other strategies across age are not significant.
Table of Data for All Categories
| Browsing Strategies |
All |
Male |
Female |
USA |
Europe |
19-25 |
26-50 |
50+ |
| Bookmark |
13391.00 82.14% |
9197.00 84.02% |
4010.00 78.24% |
10679.00 82.89% |
841.00 78.31% |
2253.00 75.68% |
8215.00 84.33% |
1791.00 85.94% |
| Index |
12447.00 76.35% |
8583.00 78.41% |
3697.00 72.14% |
9782.00 75.92% |
863.00 80.35% |
2226.00 74.77% |
7572.00 77.73% |
1544.00 74.09% |
| Metaindex |
8952.00 54.91% |
5829.00 53.25% |
3019.00 58.91% |
7337.00 56.95% |
484.00 45.07% |
1625.00 54.59% |
5398.00 55.41% |
1147.00 55.04% |
| Opportunistic |
9400.00 57.66% |
5928.00 54.16% |
3349.00 65.35% |
7619.00 59.14% |
495.00 46.09% |
1706.00 57.31% |
5630.00 57.79% |
1149.00 55.13% |
| URL |
11151.00 68.40% |
7677.00 70.14% |
3322.00 64.82% |
8943.00 69.41% |
706.00 65.74% |
2036.00 68.39% |
6671.00 68.48% |
1414.00 67.85% |


For more information or to submit comments:
send e-mail to www-survey@cc.gatech.edu.
GVU's WWW Surveying Team
Graphics, Visualization, & Usability Center
College of Computing
Georgia Institute of Technology
Atlanta, GA 30332-0280


