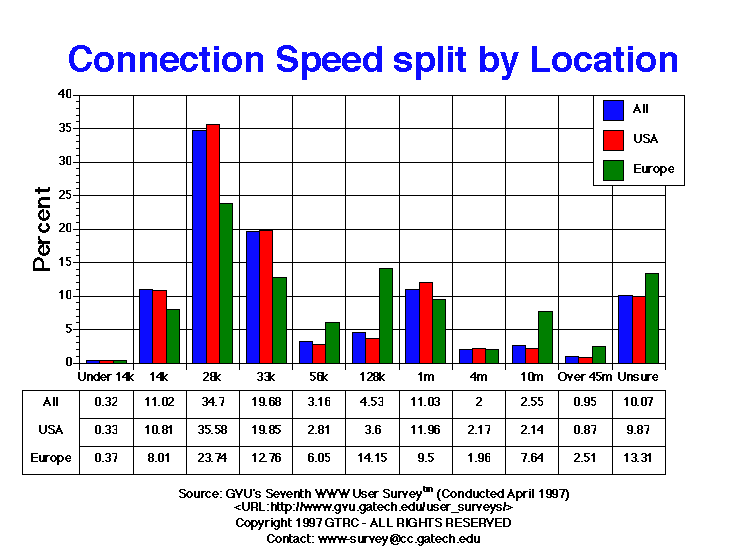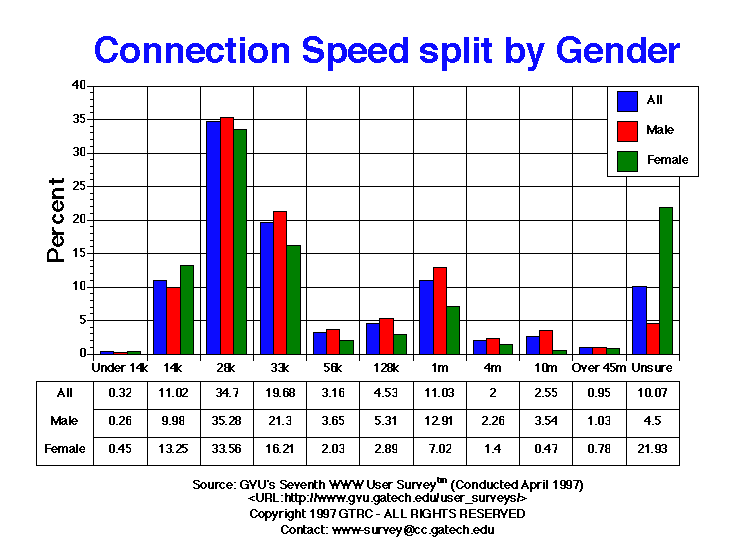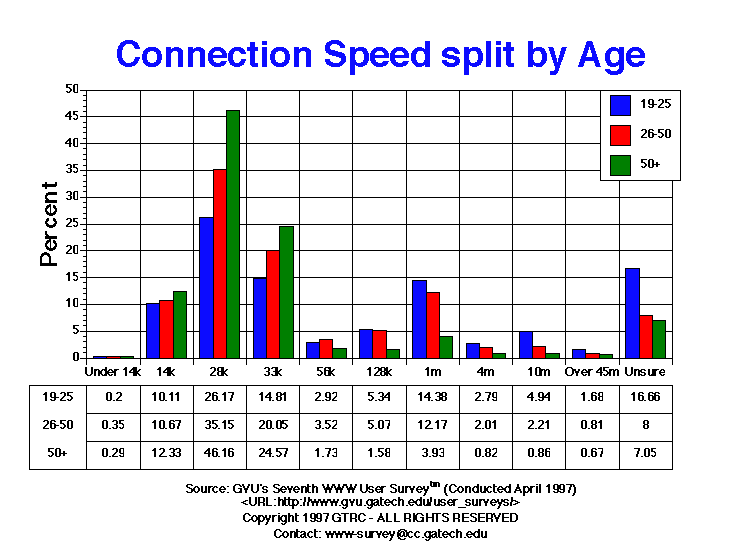

| Connection Speed | All | Male | Female | USA | Europe | 19-25 | 26-50 | 50+ |
| 10m | 416.00 2.55% |
387.00 3.54% |
24.00 0.47% |
276.00 2.14% |
82.00 7.64% |
147.00 4.94% |
215.00 2.21% |
18.00 0.86% |
| 128k | 739.00 4.53% |
581.00 5.31% |
148.00 2.89% |
464.00 3.60% |
152.00 14.15% |
159.00 5.34% |
494.00 5.07% |
33.00 1.58% |
| 14k | 1796.00 11.02% |
1092.00 9.98% |
679.00 13.25% |
1393.00 10.81% |
86.00 8.01% |
301.00 10.11% |
1039.00 10.67% |
257.00 12.33% |
| 1m | 1798.00 11.03% |
1413.00 12.91% |
360.00 7.02% |
1541.00 11.96% |
102.00 9.50% |
428.00 14.38% |
1186.00 12.17% |
82.00 3.93% |
| 28k | 5657.00 34.70% |
3862.00 35.28% |
1720.00 33.56% |
4584.00 35.58% |
255.00 23.74% |
779.00 26.17% |
3424.00 35.15% |
962.00 46.16% |
| 33k | 3208.00 19.68% |
2331.00 21.30% |
831.00 16.21% |
2558.00 19.85% |
137.00 12.76% |
441.00 14.81% |
1953.00 20.05% |
512.00 24.57% |
| 4m | 326.00 2.00% |
247.00 2.26% |
72.00 1.40% |
280.00 2.17% |
21.00 1.96% |
83.00 2.79% |
196.00 2.01% |
17.00 0.82% |
| 56k | 515.00 3.16% |
399.00 3.65% |
104.00 2.03% |
362.00 2.81% |
65.00 6.05% |
87.00 2.92% |
343.00 3.52% |
36.00 1.73% |
| Over 45m | 155.00 0.95% |
113.00 1.03% |
40.00 0.78% |
112.00 0.87% |
27.00 2.51% |
50.00 1.68% |
79.00 0.81% |
14.00 0.67% |
| Under 14k | 52.00 0.32% |
28.00 0.26% |
23.00 0.45% |
42.00 0.33% |
4.00 0.37% |
6.00 0.20% |
34.00 0.35% |
6.00 0.29% |
| Unsure | 1641.00 10.07% |
493.00 4.50% |
1124.00 21.93% |
1272.00 9.87% |
143.00 13.31% |
496.00 16.66% |
779.00 8.00% |
147.00 7.05% |


GVU's WWW Surveying Team
Graphics, Visualization, & Usability Center
College of Computing
Georgia Institute of Technology
Atlanta, GA 30332-0280