
| Electronic News | All | Male | Female | USA | Europe | 19-25 | 26-50 | 50+ |
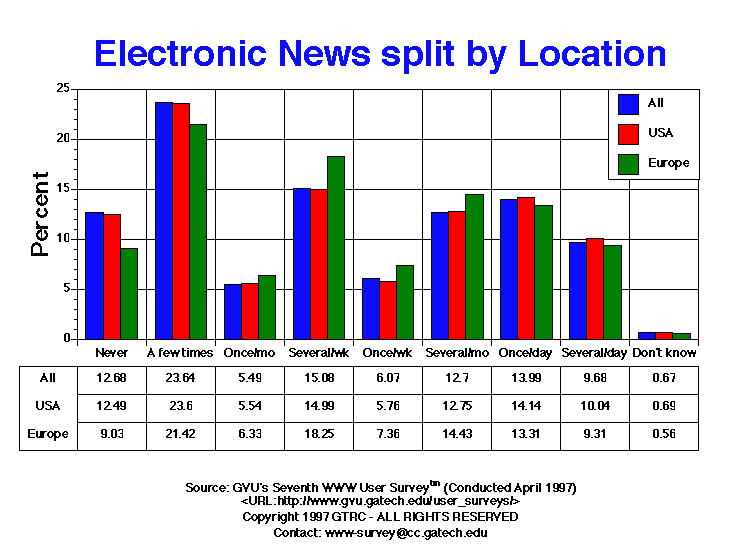
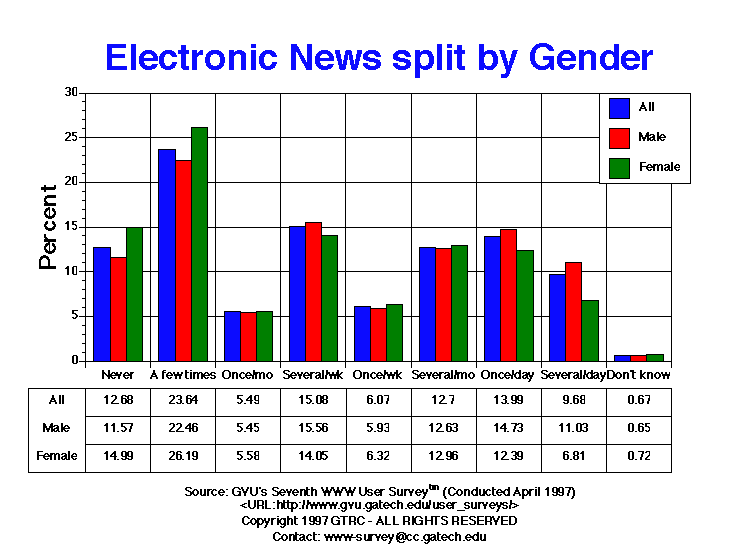
| A few times | 3854.00 23.64% |
2458.00 22.46% |
1342.00 26.19% |
3040.00 23.60% |
230.00 21.42% |
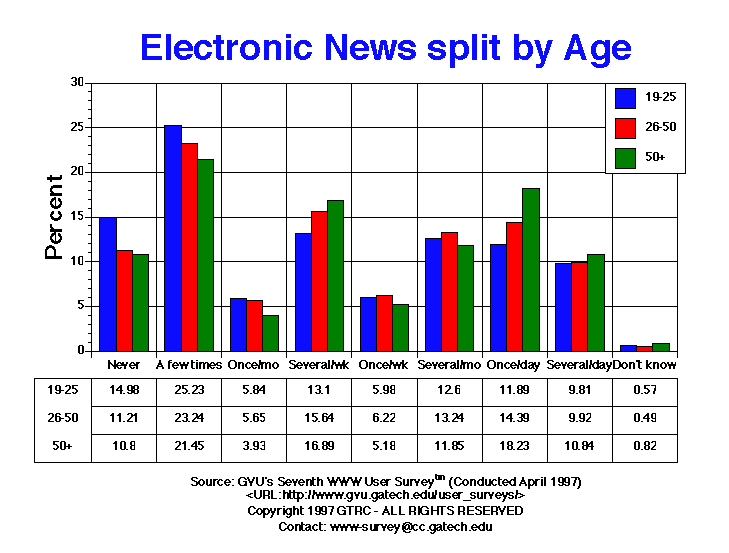
751.00 25.23% |
2264.00 23.24% |
447.00 21.45% |
| Don't know | 109.00 0.67% |
71.00 0.65% |
37.00 0.72% |
89.00 0.69% |
6.00 0.56% |
17.00 0.57% |
48.00 0.49% |
17.00 0.82% |
| Never | 2067.00 12.68% |
1266.00 11.57% |
768.00 14.99% |
1609.00 12.49% |
97.00 9.03% |
446.00 14.98% |
1092.00 11.21% |
225.00 10.80% |
| Once per day | 2281.00 13.99% |
1612.00 14.73% |
635.00 12.39% |
1822.00 14.14% |
143.00 13.31% |
354.00 11.89% |
1402.00 14.39% |
380.00 18.23% |
| Once per month | 895.00 5.49% |
597.00 5.45% |
286.00 5.58% |
714.00 5.54% |
68.00 6.33% |
174.00 5.84% |
550.00 5.65% |
82.00 3.93% |
| Once per week | 989.00 6.07% |
649.00 5.93% |
324.00 6.32% |
742.00 5.76% |
79.00 7.36% |
178.00 5.98% |
606.00 6.22% |
108.00 5.18% |
| Several times per day | 1578.00 9.68% |
1207.00 11.03% |
349.00 6.81% |
1294.00 10.04% |
100.00 9.31% |
292.00 9.81% |
966.00 9.92% |
226.00 10.84% |
| Several times per month | 2071.00 12.70% |
1383.00 12.63% |
664.00 12.96% |
1643.00 12.75% |
155.00 14.43% |
375.00 12.60% |
1290.00 13.24% |
247.00 11.85% |
| Several times per week | 2459.00 15.08% |
1703.00 15.56% |
720.00 14.05% |
1931.00 14.99% |
196.00 18.25% |
390.00 13.10% |
1524.00 15.64% |
352.00 16.89% |


GVU's WWW Surveying Team
Graphics, Visualization, & Usability Center
College of Computing
Georgia Institute of Technology
Atlanta, GA 30332-0280