
| Financial Material | All | Male | Female | USA | Europe | 19-25 | 26-50 | 50+ |
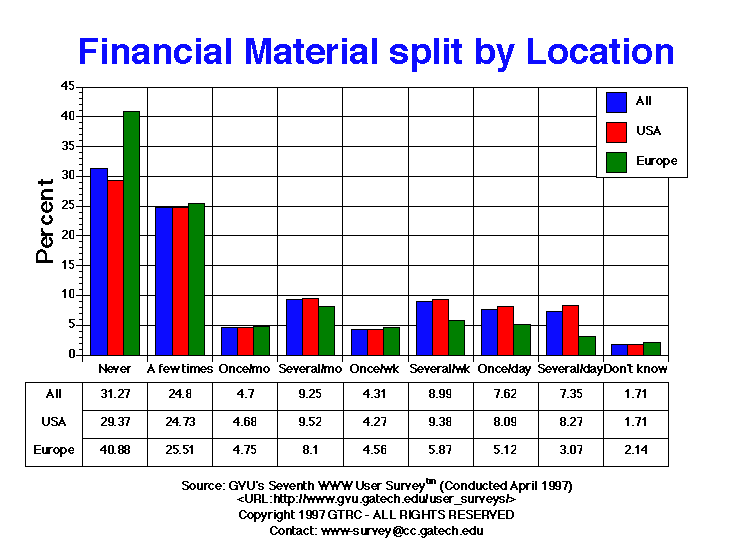
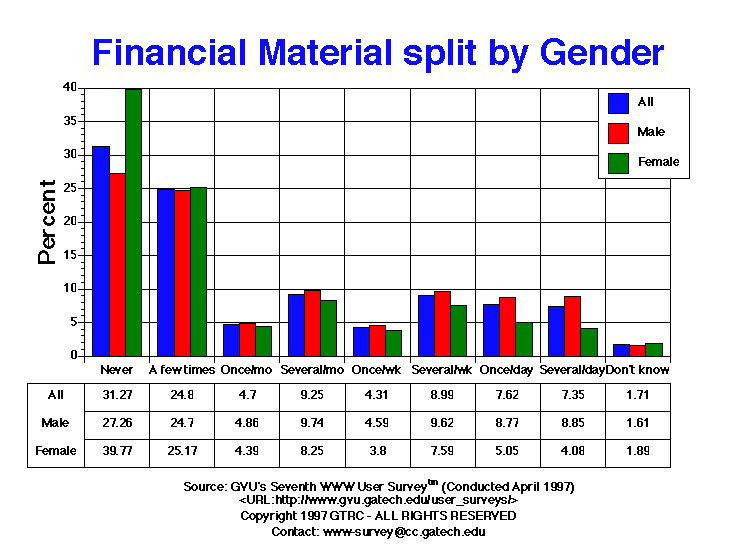
| A few times | 4043.00 24.80% |
2704.00 24.70% |
1290.00 25.17% |
3186.00 24.73% |
274.00 25.51% |
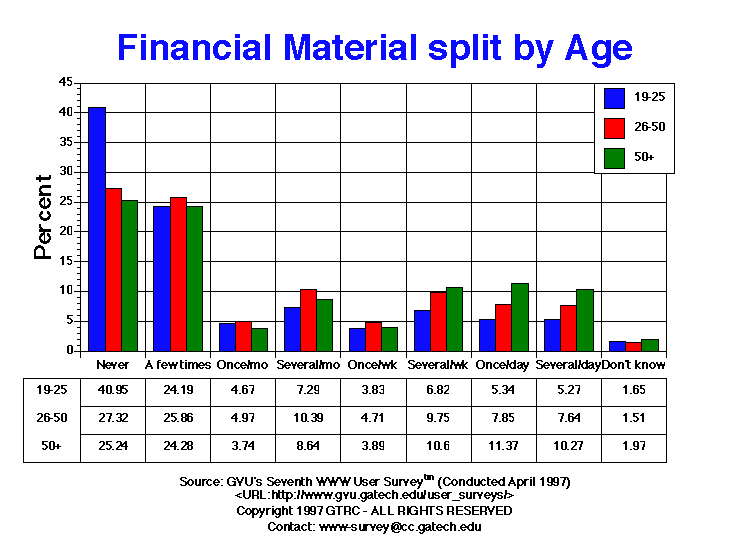
720.00 24.19% |
2519.00 25.86% |
506.00 24.28% |
| Don't know | 278.00 1.71% |
176.00 1.61% |
97.00 1.89% |
220.00 1.71% |
23.00 2.14% |
49.00 1.65% |
147.00 1.51% |
41.00 1.97% |
| Never | 5098.00 31.27% |
2984.00 27.26% |
2038.00 39.77% |
3784.00 29.37% |
439.00 40.88% |
1219.00 40.95% |
2662.00 27.32% |
526.00 25.24% |
| Once per day | 1243.00 7.62% |
960.00 8.77% |
259.00 5.05% |
1042.00 8.09% |
55.00 5.12% |
159.00 5.34% |
765.00 7.85% |
237.00 11.37% |
| Once per month | 767.00 4.70% |
532.00 4.86% |
225.00 4.39% |
603.00 4.68% |
51.00 4.75% |
139.00 4.67% |
484.00 4.97% |
78.00 3.74% |
| Once per week | 702.00 4.31% |
502.00 4.59% |
195.00 3.80% |
550.00 4.27% |
49.00 4.56% |
114.00 3.83% |
459.00 4.71% |
81.00 3.89% |
| Several times per day | 1198.00 7.35% |
969.00 8.85% |
209.00 4.08% |
1065.00 8.27% |
33.00 3.07% |
157.00 5.27% |
744.00 7.64% |
214.00 10.27% |
| Several times per month | 1508.00 9.25% |
1066.00 9.74% |
423.00 8.25% |
1226.00 9.52% |
87.00 8.10% |
217.00 7.29% |
1012.00 10.39% |
180.00 8.64% |
| Several times per week | 1466.00 8.99% |
1053.00 9.62% |
389.00 7.59% |
1208.00 9.38% |
63.00 5.87% |
203.00 6.82% |
950.00 9.75% |
221.00 10.60% |


GVU's WWW Surveying Team
Graphics, Visualization, & Usability Center
College of Computing
Georgia Institute of Technology
Atlanta, GA 30332-0280