
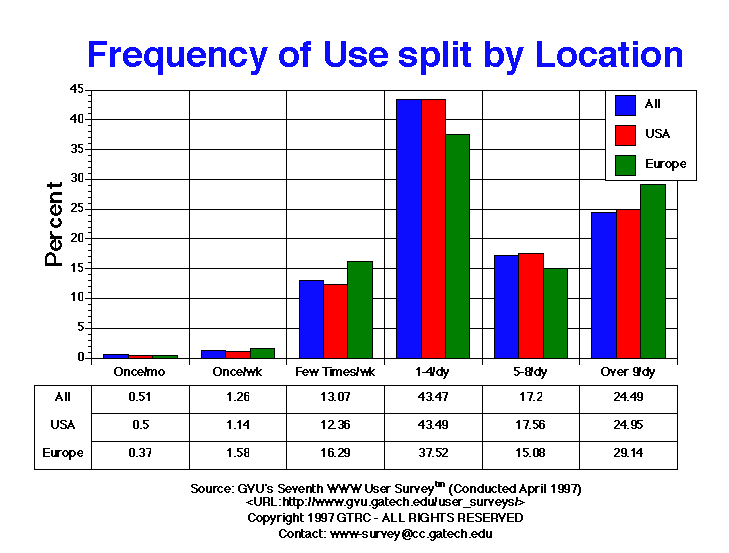
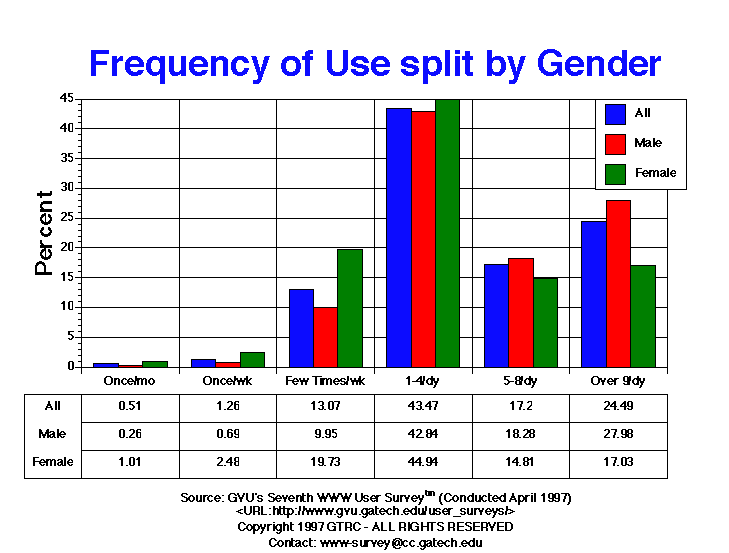
| Frequency of Use | All | Male | Female | USA | Europe | 19-25 | 26-50 | 50+ |
| 1-4/dy | 7087.00 43.47% |
4689.00 42.84% |
2303.00 44.94% |
5603.00 43.49% |
403.00 37.52% |
1103.00 37.05% |
4205.00 43.16% |
1164.00 55.85% |
| 5-8/dy | 2804.00 17.20% |
2001.00 18.28% |
759.00 14.81% |
2262.00 17.56% |
162.00 15.08% |
579.00 19.45% |
1666.00 17.10% |
311.00 14.92% |
| Few Times/wk | 2130.00 13.07% |
1089.00 9.95% |
1011.00 19.73% |
1593.00 12.36% |
175.00 16.29% |
400.00 13.44% |
1170.00 12.01% |
300.00 14.40% |
| Once/mo | 83.00 0.51% |
28.00 0.26% |
52.00 1.01% |
64.00 0.50% |
4.00 0.37% |
22.00 0.74% |
37.00 0.38% |
7.00 0.34% |
| Once/wk | 206.00 1.26% |
76.00 0.69% |
127.00 2.48% |
147.00 1.14% |
17.00 1.58% |
52.00 1.75% |
107.00 1.10% |
25.00 1.20% |
| Over 9/dy | 3993.00 24.49% |
3063.00 27.98% |
873.00 17.03% |
3215.00 24.95% |
313.00 29.14% |
821.00 27.58% |
2557.00 26.25% |
277.00 13.29% |

GVU's WWW Surveying Team
Graphics, Visualization, & Usability Center
College of Computing
Georgia Institute of Technology
Atlanta, GA 30332-0280