
Hours Used
Notes:
- While the number of times browsers are used per day has increased since the last survey, the number of hours
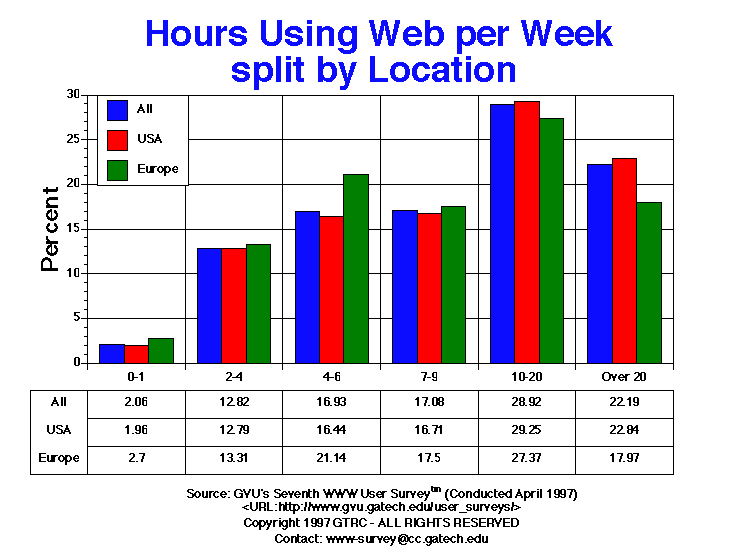
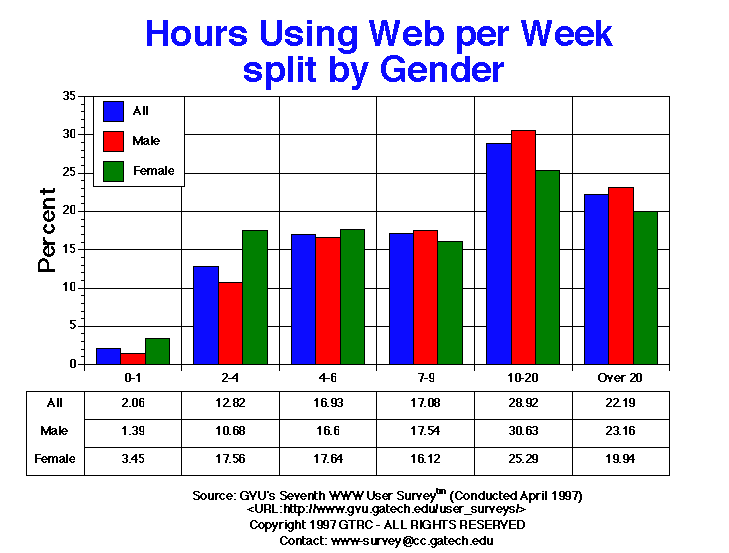
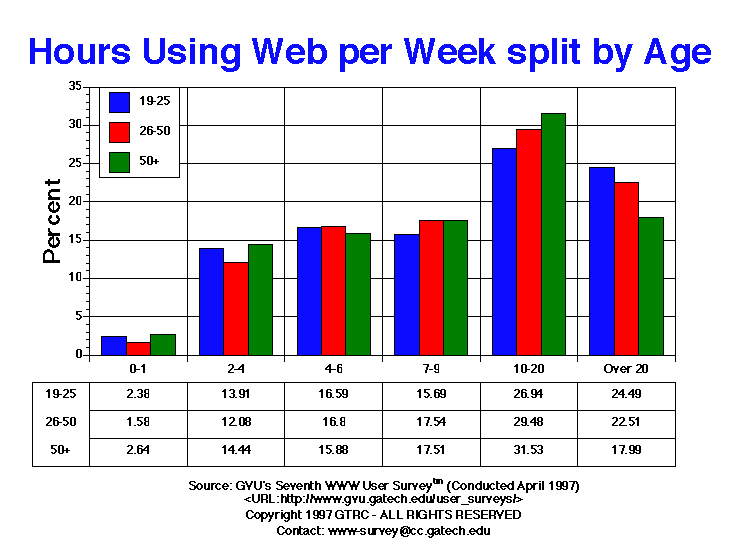
people user the Web has remain about the same, with just over one in five users (22.19%) reporting using their browsers over 20 hours per week. 28.92% of the users spend 10 to 20 hours a week on the Web, with 17.08% spending 7 to 9 hrs/wk and 14.84% spending 4 to 6 hrs per week. Casual use of less than 5 hours per week is down from 16.87% in the Fifth Survey and 15.18% in the Sixth to 14.88% in the Seventh, further emphasizing the trend towards increased usage. For comparison, in the Third Survey conducted in April of 1995, only 28.46% of the users spent more than 10 hrs/wk on the Web. Twenty-four months later, nearly twice as many users (51.1%) spend more than 10 hrs/wk! Females, older users, and US users are more likely to spend less time on the Web than their counterparts. The average number of hours per week user spend on the Web is 13.6, which is slightly more than the 9.1 hours/week reported by FIND/SVP's 1997 American Internet User Survey, thus reflecting a bias in our sample towards heavier users of the Web. This makes sense given that only those users that use the Web regularly are likely to participate in our surveys.
Table of Data for All Categories
| Hours Used |
All |
Male |
Female |
USA |
Europe |
19-25 |
26-50 |
50+ |
| 0-1 |
336.00 2.06% |
152.00 1.39% |
177.00 3.45% |
253.00 1.96% |
29.00 2.70% |
71.00 2.38% |
154.00 1.58% |
55.00 2.64% |
| 10-20 |
4715.00 28.92% |
3353.00 30.63% |
1296.00 25.29% |
3769.00 29.25% |
294.00 27.37% |
802.00 26.94% |
2872.00 29.48% |
657.00 31.53% |
| 2-4 |
2090.00 12.82% |
1169.00 10.68% |
900.00 17.56% |
1648.00 12.79% |
143.00 13.31% |
414.00 13.91% |
1177.00 12.08% |
301.00 14.44% |
| 4-6 |
2760.00 16.93% |
1817.00 16.60% |
904.00 17.64% |
2118.00 16.44% |
227.00 21.14% |
494.00 16.59% |
1637.00 16.80% |
331.00 15.88% |
| 7-9 |
2784.00 17.08% |
1920.00 17.54% |
826.00 16.12% |
2153.00 16.71% |
188.00 17.50% |
467.00 15.69% |
1709.00 17.54% |
365.00 17.51% |
| Over 20 |
3618.00 22.19% |
2535.00 23.16% |
1022.00 19.94% |
2943.00 22.84% |
193.00 17.97% |
729.00 24.49% |
2193.00 22.51% |
375.00 17.99% |
For more information or to submit comments:
send e-mail to www-survey@cc.gatech.edu.
GVU's WWW Surveying Team
Graphics, Visualization, & Usability Center
College of Computing
Georgia Institute of Technology
Atlanta, GA 30332-0280