Image Loading
Notes:
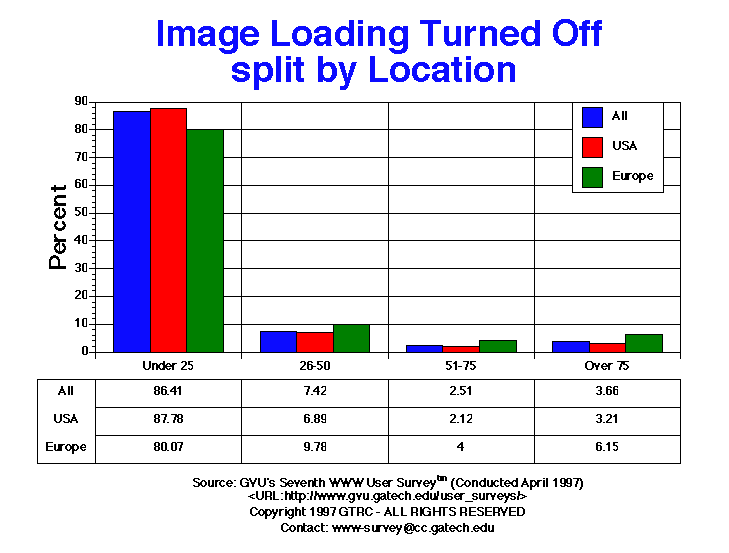
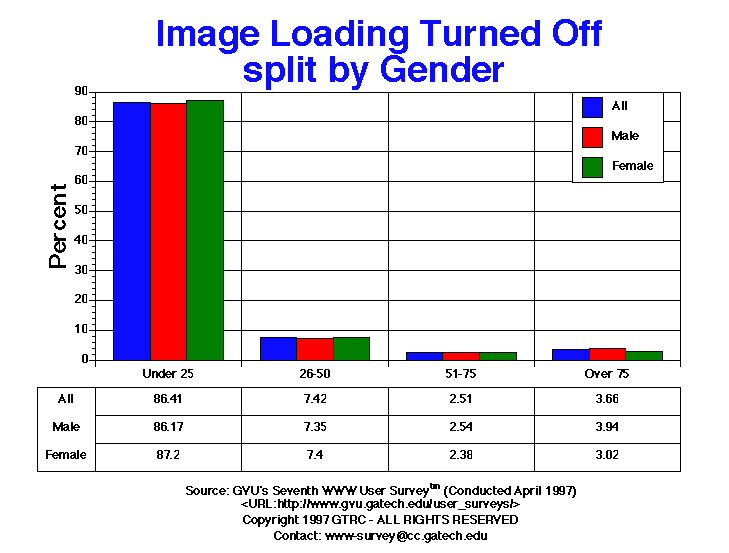
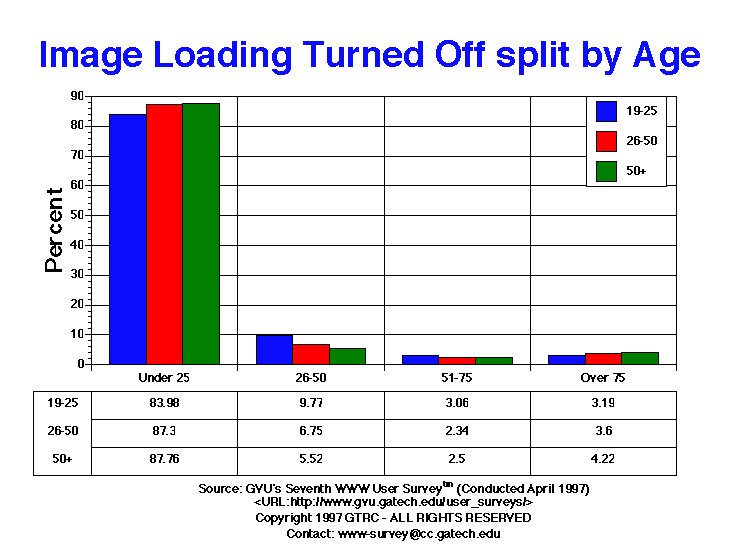
- This is a relatively new question to the Surveys (started in the Sixth Survey), but one that we've been meaning to ask for quite some time due to the numerous queries we field about how often people surf without images being loaded for each page automatically. This is a big concern for graphic designers who are faced with the opposing goals of producing media rich content that everyone can access quickly. As with the Sixth Survey, most people surf with images loaded automatically as (86.41% Seventh vs. 85.40% Sixth) report turning image loading off under 25% of the time. The remaining 13.59% report not loading image anywhere from 26 to 100% of the time. As one might expect due to the slow transoceanic connection between US and Europe, more Europeans turn image loading off. Differences between gender were not observed, though younger users are more likely to have image loading turned off.
Table of Data for All Categories
| Image Loading |
All |
Male |
Female |
USA |
Europe |
19-25 |
26-50 |
50+ |
| 26-50 |
1209.00 7.42% |
805.00 7.35% |
379.00 7.40% |
888.00 6.89% |
105.00 9.78% |
291.00 9.77% |
658.00 6.75% |
115.00 5.52% |
| 51-75 |
410.00 2.51% |
278.00 2.54% |
122.00 2.38% |
273.00 2.12% |
43.00 4.00% |
91.00 3.06% |
228.00 2.34% |
52.00 2.50% |
| Over 75 |
596.00 3.66% |
431.00 3.94% |
155.00 3.02% |
413.00 3.21% |
66.00 6.15% |
95.00 3.19% |
351.00 3.60% |
88.00 4.22% |
| Under 25 |
14088.00 86.41% |
9432.00 86.17% |
4469.00 87.20% |
11310.00 87.78% |
860.00 80.07% |
2500.00 83.98% |
8505.00 87.30% |
1829.00 87.76% |


For more information or to submit comments:
send e-mail to www-survey@cc.gatech.edu.
GVU's WWW Surveying Team
Graphics, Visualization, & Usability Center
College of Computing
Georgia Institute of Technology
Atlanta, GA 30332-0280


