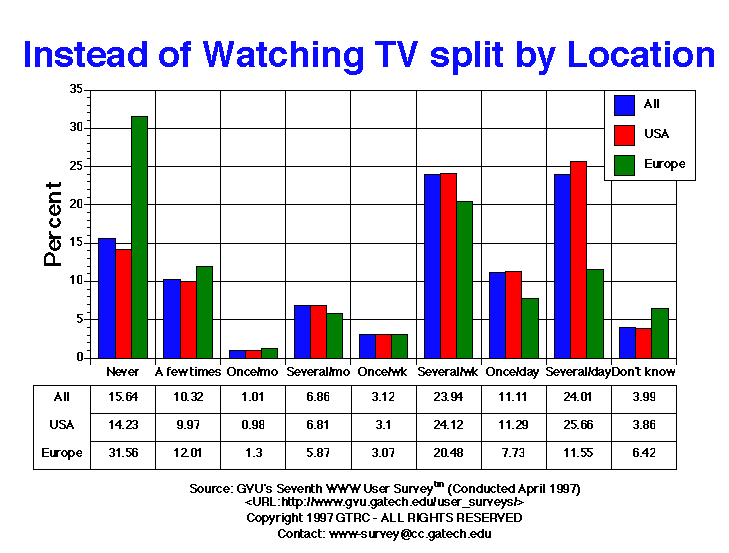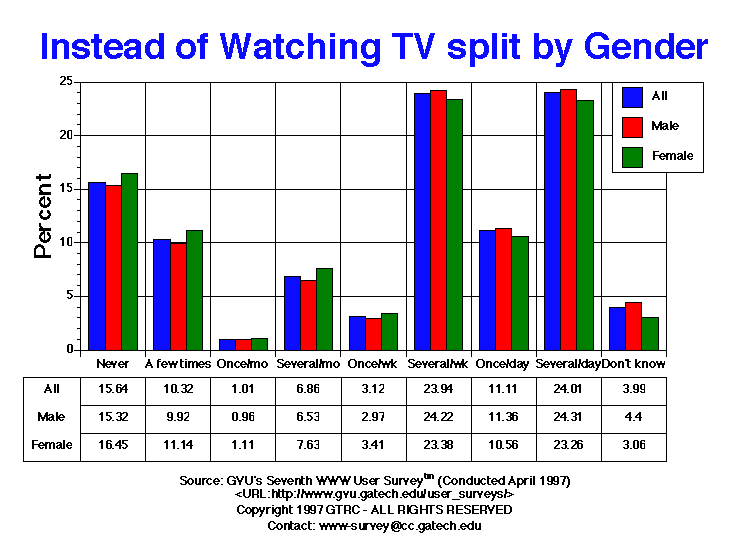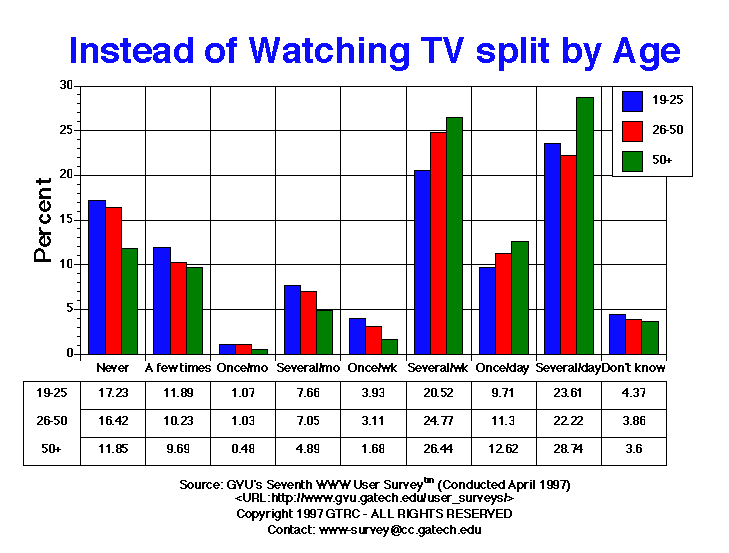

| Instead of Watching TV | All | Male | Female | USA | Europe | 19-25 | 26-50 | 50+ |
| A few times | 1683.00 10.32% |
1086.00 9.92% |
571.00 11.14% |
1285.00 9.97% |
129.00 12.01% |
354.00 11.89% |
997.00 10.23% |
202.00 9.69% |
| Don't know | 650.00 3.99% |
482.00 4.40% |
157.00 3.06% |
497.00 3.86% |
69.00 6.42% |
130.00 4.37% |
376.00 3.86% |
75.00 3.60% |
| Never | 2550.00 15.64% |
1677.00 15.32% |
843.00 16.45% |
1833.00 14.23% |
339.00 31.56% |
513.00 17.23% |
1600.00 16.42% |
247.00 11.85% |
| Once per day | 1811.00 11.11% |
1244.00 11.36% |
541.00 10.56% |
1454.00 11.29% |
83.00 7.73% |
289.00 9.71% |
1101.00 11.30% |
263.00 12.62% |
| Once per month | 165.00 1.01% |
105.00 0.96% |
57.00 1.11% |
126.00 0.98% |
14.00 1.30% |
32.00 1.07% |
100.00 1.03% |
10.00 0.48% |
| Once per week | 508.00 3.12% |
325.00 2.97% |
175.00 3.41% |
399.00 3.10% |
33.00 3.07% |
117.00 3.93% |
303.00 3.11% |
35.00 1.68% |
| Several times per day | 3914.00 24.01% |
2661.00 24.31% |
1192.00 23.26% |
3306.00 25.66% |
124.00 11.55% |
703.00 23.61% |
2165.00 22.22% |
599.00 28.74% |
| Several times per month | 1119.00 6.86% |
715.00 6.53% |
391.00 7.63% |
877.00 6.81% |
63.00 5.87% |
228.00 7.66% |
687.00 7.05% |
102.00 4.89% |
| Several times per week | 3903.00 23.94% |
2651.00 24.22% |
1198.00 23.38% |
3107.00 24.12% |
220.00 20.48% |
611.00 20.52% |
2413.00 24.77% |
551.00 26.44% |


GVU's WWW Surveying Team
Graphics, Visualization, & Usability Center
College of Computing
Georgia Institute of Technology
Atlanta, GA 30332-0280