
| Monitor Color Support | All | Male | Female | USA | Europe | 19-25 | 26-50 | 50+ |
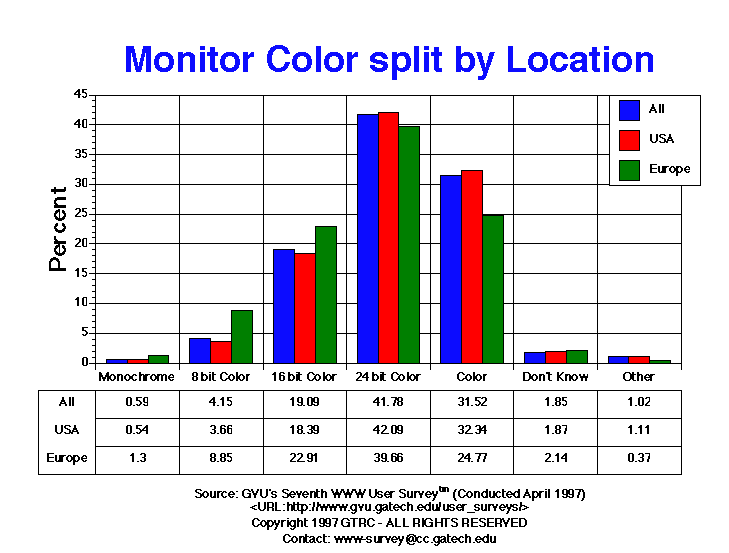
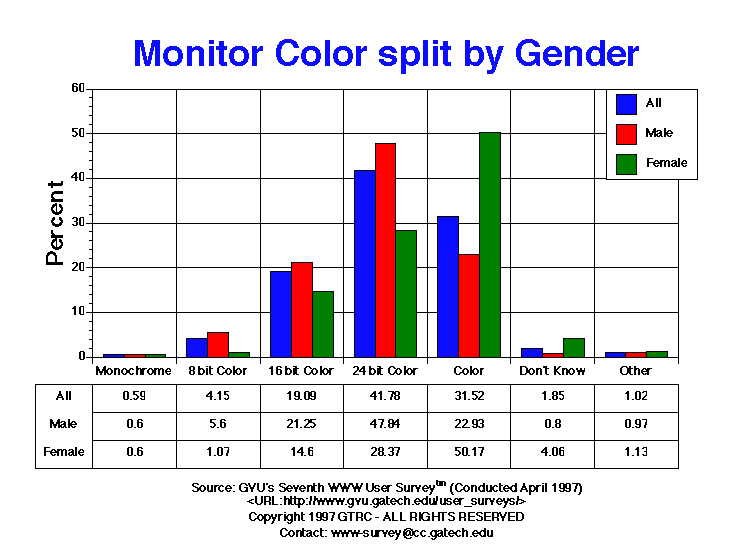
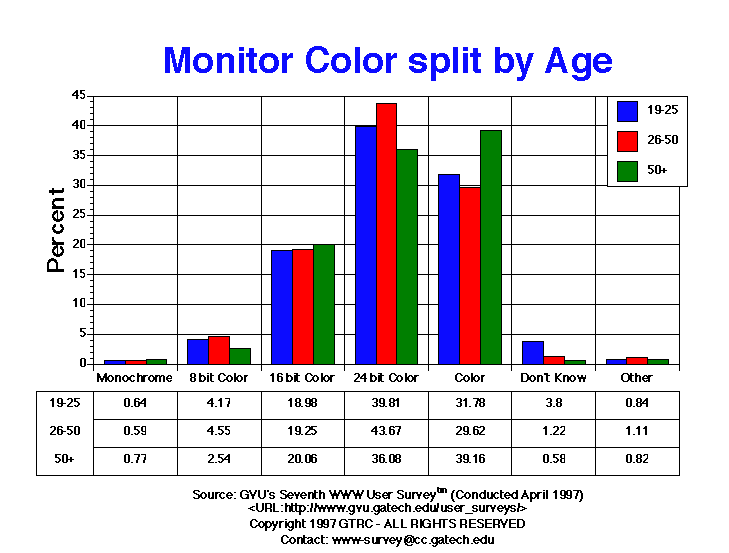
| 16 bit Color | 3112.00 19.09% |
2326.00 21.25% |
748.00 14.60% |
2369.00 18.39% |
246.00 22.91% |
565.00 18.98% |
1875.00 19.25% |
418.00 20.06% |
| 24 bit Color | 6812.00 41.78% |
5237.00 47.84% |
1454.00 28.37% |
5423.00 42.09% |
426.00 39.66% |
1185.00 39.81% |
4254.00 43.67% |
752.00 36.08% |
| 8 bit Color | 676.00 4.15% |
613.00 5.60% |
55.00 1.07% |
472.00 3.66% |
95.00 8.85% |
124.00 4.17% |
443.00 4.55% |
53.00 2.54% |
| Color | 5138.00 31.52% |
2510.00 22.93% |
2571.00 50.17% |
4167.00 32.34% |
266.00 24.77% |
946.00 31.78% |
2886.00 29.62% |
816.00 39.16% |
| Don't Know | 301.00 1.85% |
88.00 0.80% |
208.00 4.06% |
241.00 1.87% |
23.00 2.14% |
113.00 3.80% |
119.00 1.22% |
12.00 0.58% |
| Monochrome | 97.00 0.59% |
66.00 0.60% |
31.00 0.60% |
69.00 0.54% |
14.00 1.30% |
19.00 0.64% |
57.00 0.59% |
16.00 0.77% |
| Other | 167.00 1.02% |
106.00 0.97% |
58.00 1.13% |
143.00 1.11% |
4.00 0.37% |
25.00 0.84% |
108.00 1.11% |
17.00 0.82% |


GVU's WWW Surveying Team
Graphics, Visualization, & Usability Center
College of Computing
Georgia Institute of Technology
Atlanta, GA 30332-0280