
| Monitor Resolution | All | Male | Female | USA | Europe | 19-25 | 26-50 | 50+ |
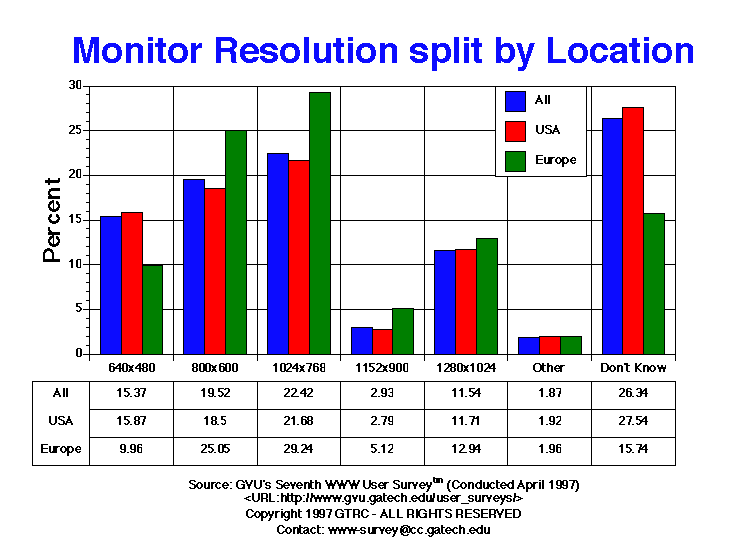
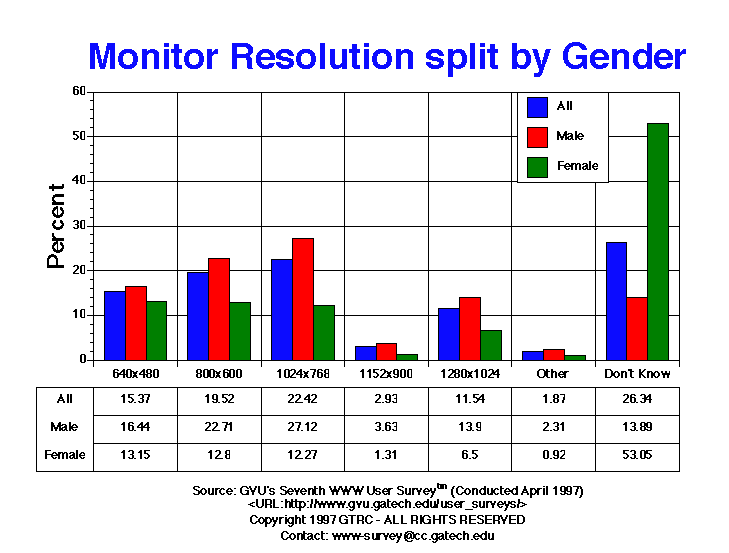
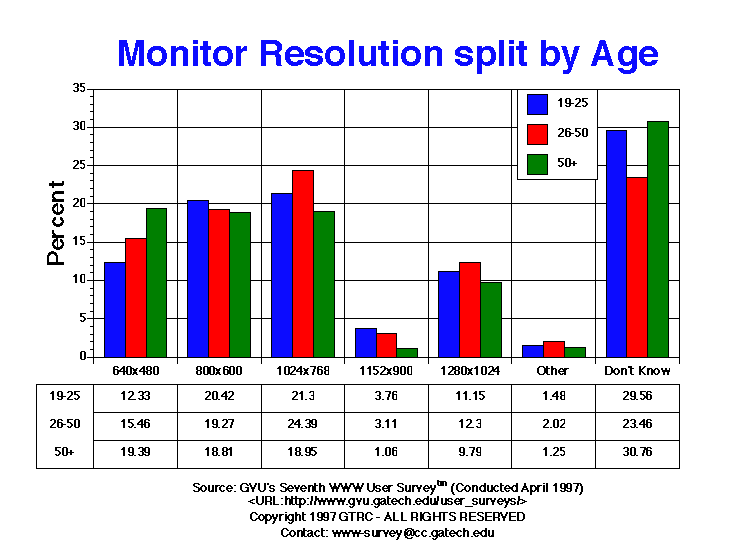
| 1024x768 | 3655.00 22.42% |
2969.00 27.12% |
629.00 12.27% |
2793.00 21.68% |
314.00 29.24% |
634.00 21.30% |
2376.00 24.39% |
395.00 18.95% |
| 1152x900 | 478.00 2.93% |
397.00 3.63% |
67.00 1.31% |
359.00 2.79% |
55.00 5.12% |
112.00 3.76% |
303.00 3.11% |
22.00 1.06% |
| 1280x1024 | 1882.00 11.54% |
1521.00 13.90% |
333.00 6.50% |
1509.00 11.71% |
139.00 12.94% |
332.00 11.15% |
1198.00 12.30% |
204.00 9.79% |
| 640x480 | 2506.00 15.37% |
1800.00 16.44% |
674.00 13.15% |
2045.00 15.87% |
107.00 9.96% |
367.00 12.33% |
1506.00 15.46% |
404.00 19.39% |
| 800x600 | 3183.00 19.52% |
2486.00 22.71% |
656.00 12.80% |
2383.00 18.50% |
269.00 25.05% |
608.00 20.42% |
1877.00 19.27% |
392.00 18.81% |
| Don't Know | 4294.00 26.34% |
1520.00 13.89% |
2719.00 53.05% |
3548.00 27.54% |
169.00 15.74% |
880.00 29.56% |
2285.00 23.46% |
641.00 30.76% |
| Other | 305.00 1.87% |
253.00 2.31% |
47.00 0.92% |
247.00 1.92% |
21.00 1.96% |
44.00 1.48% |
197.00 2.02% |
26.00 1.25% |


GVU's WWW Surveying Team
Graphics, Visualization, & Usability Center
College of Computing
Georgia Institute of Technology
Atlanta, GA 30332-0280