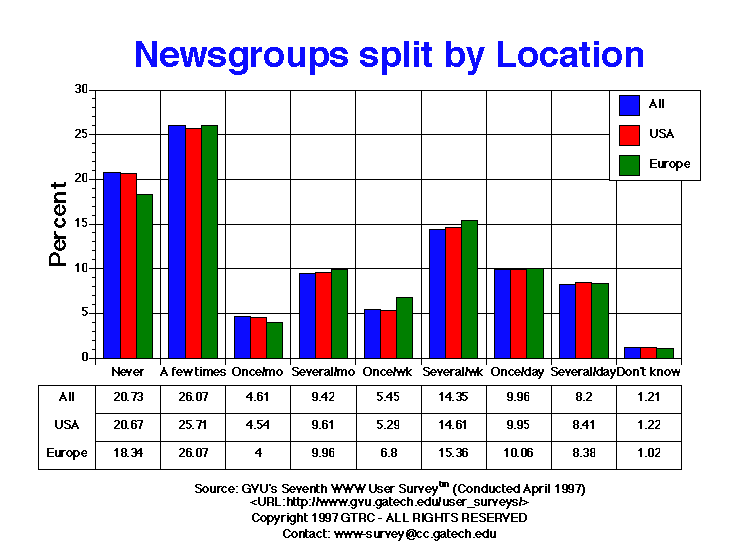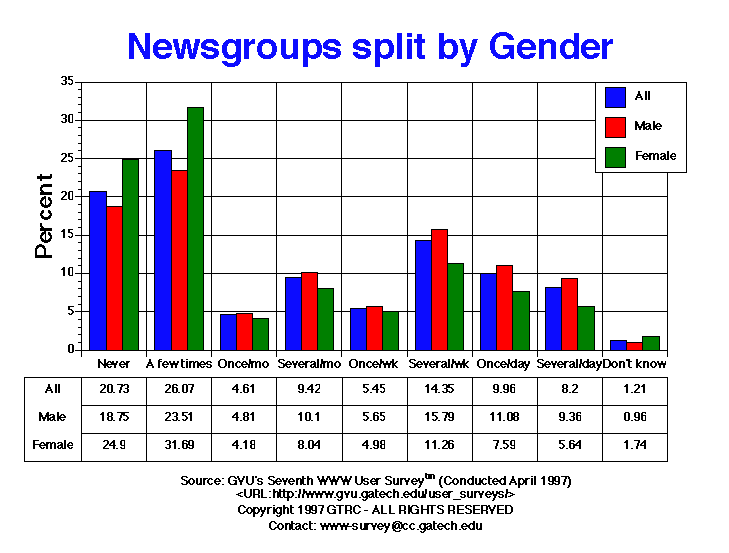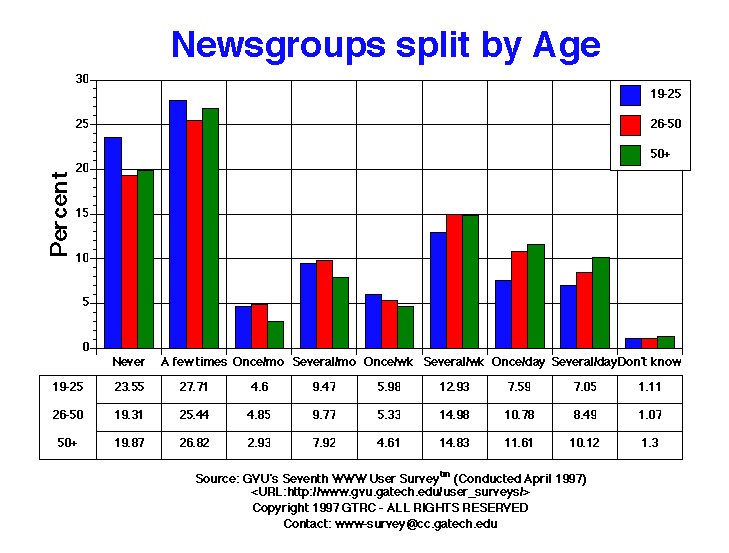

| Newsgroups | All | Male | Female | USA | Europe | 19-25 | 26-50 | 50+ |
| A few times | 4250.00 26.07% |
2573.00 23.51% |
1624.00 31.69% |
3312.00 25.71% |
280.00 26.07% |
825.00 27.71% |
2478.00 25.44% |
559.00 26.82% |
| Don't know | 197.00 1.21% |
105.00 0.96% |
89.00 1.74% |
157.00 1.22% |
11.00 1.02% |
33.00 1.11% |
104.00 1.07% |
27.00 1.30% |
| Never | 3380.00 20.73% |
2052.00 18.75% |
1276.00 24.90% |
2663.00 20.67% |
197.00 18.34% |
701.00 23.55% |
1881.00 19.31% |
414.00 19.87% |
| Once per day | 1624.00 9.96% |
1213.00 11.08% |
389.00 7.59% |
1282.00 9.95% |
108.00 10.06% |
226.00 7.59% |
1050.00 10.78% |
242.00 11.61% |
| Once per month | 751.00 4.61% |
527.00 4.81% |
214.00 4.18% |
585.00 4.54% |
43.00 4.00% |
137.00 4.60% |
472.00 4.85% |
61.00 2.93% |
| Once per week | 889.00 5.45% |
618.00 5.65% |
255.00 4.98% |
681.00 5.29% |
73.00 6.80% |
178.00 5.98% |
519.00 5.33% |
96.00 4.61% |
| Several times per day | 1337.00 8.20% |
1024.00 9.36% |
289.00 5.64% |
1084.00 8.41% |
90.00 8.38% |
210.00 7.05% |
827.00 8.49% |
211.00 10.12% |
| Several times per month | 1536.00 9.42% |
1106.00 10.10% |
412.00 8.04% |
1238.00 9.61% |
107.00 9.96% |
282.00 9.47% |
952.00 9.77% |
165.00 7.92% |
| Several times per week | 2339.00 14.35% |
1728.00 15.79% |
577.00 11.26% |
1882.00 14.61% |
165.00 15.36% |
385.00 12.93% |
1459.00 14.98% |
309.00 14.83% |


GVU's WWW Surveying Team
Graphics, Visualization, & Usability Center
College of Computing
Georgia Institute of Technology
Atlanta, GA 30332-0280