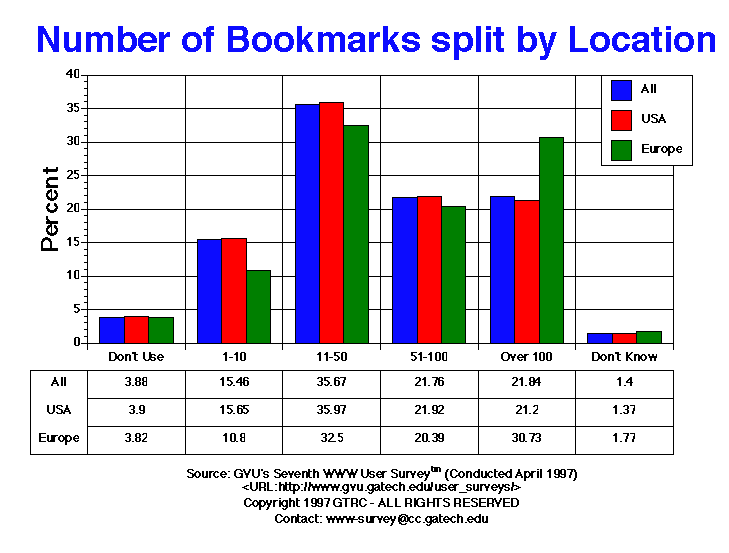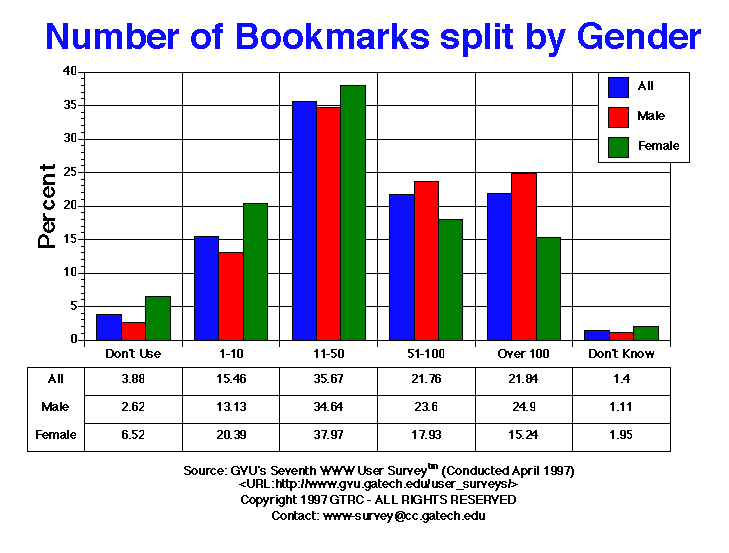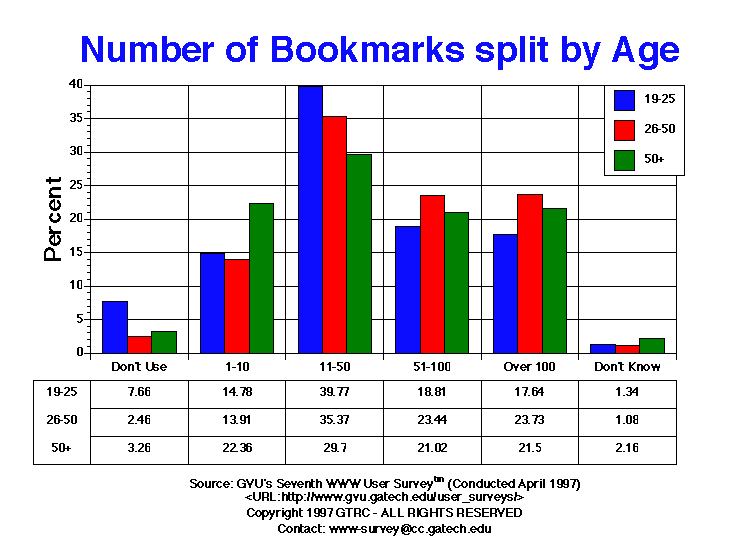

| Number of Items in Favorites Bookmark | All | Male | Female | USA | Europe | 19-25 | 26-50 | 50+ |
| 1-10 | 2520.00 15.46% |
1437.00 13.13% |
1045.00 20.39% |
2016.00 15.65% |
116.00 10.80% |
440.00 14.78% |
1355.00 13.91% |
466.00 22.36% |
| 11-50 | 5815.00 35.67% |
3792.00 34.64% |
1946.00 37.97% |
4634.00 35.97% |
349.00 32.50% |
1184.00 39.77% |
3446.00 35.37% |
619.00 29.70% |
| 51-100 | 3547.00 21.76% |
2583.00 23.60% |
919.00 17.93% |
2824.00 21.92% |
219.00 20.39% |
560.00 18.81% |
2284.00 23.44% |
438.00 21.02% |
| Don't Know | 229.00 1.40% |
121.00 1.11% |
100.00 1.95% |
176.00 1.37% |
19.00 1.77% |
40.00 1.34% |
105.00 1.08% |
45.00 2.16% |
| Don't Use | 632.00 3.88% |
287.00 2.62% |
334.00 6.52% |
503.00 3.90% |
41.00 3.82% |
228.00 7.66% |
240.00 2.46% |
68.00 3.26% |
| Over 100 | 3560.00 21.84% |
2726.00 24.90% |
781.00 15.24% |
2731.00 21.20% |
330.00 30.73% |
525.00 17.64% |
2312.00 23.73% |
448.00 21.50% |


GVU's WWW Surveying Team
Graphics, Visualization, & Usability Center
College of Computing
Georgia Institute of Technology
Atlanta, GA 30332-0280