
Primary Uses of Browser
Notes:
- For the Seventh Survey, we added several new categories called "Information Gathering", "Searching", and "Communication." Since, users were allowed to mark more than one answer, certain comparisons between the Seventh Survey and previous Surveys is possible. We also removed the "Business Research" and "Academic Research" options. With this format, users placed more value on information and communication capabilities than browsing and entertainment as with previous surveys.
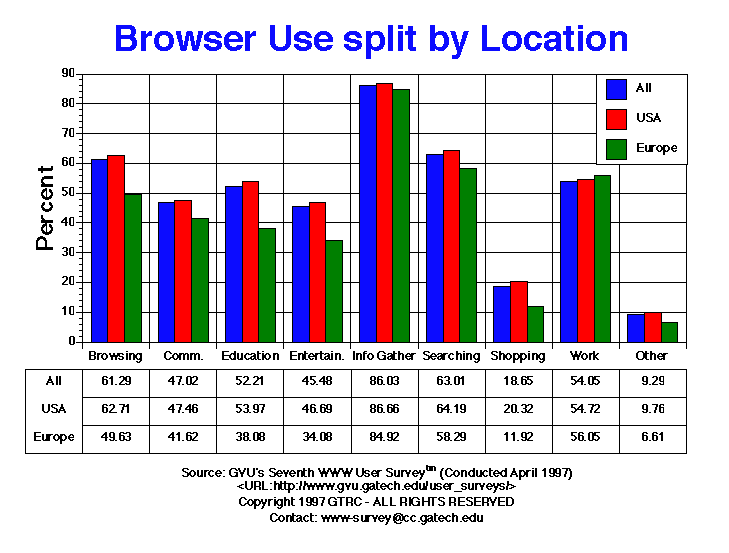
- The most common Web activity is to gather information (86.03%), followed by searching (63.01), browsing (61.29%), work (54.05%), education (52.21%), communication (47.02%), and entertainment (45.48%). Shopping remained stable (18.65%) from the Sixth Survey (18.83%), though this is much higher than the Fifth Survey a year ago where 14.91% reported shopping (11.1% in the Fourth Survey). For the US, one in five users report using the Web for shopping (20.32%). This represents a moderate and steady growth of the Web for shopping, a trend that is expected to continue, as online transactions become easier and more choices become available. Europeans tend to report less recreational uses of the Web than do US users.
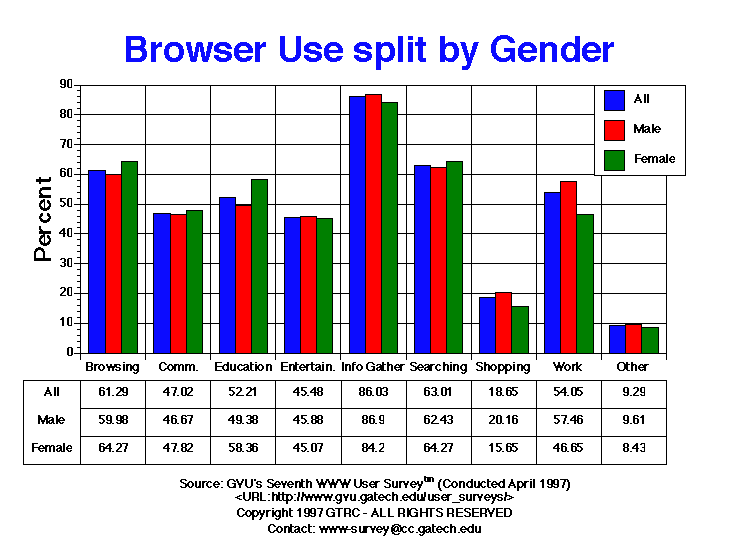
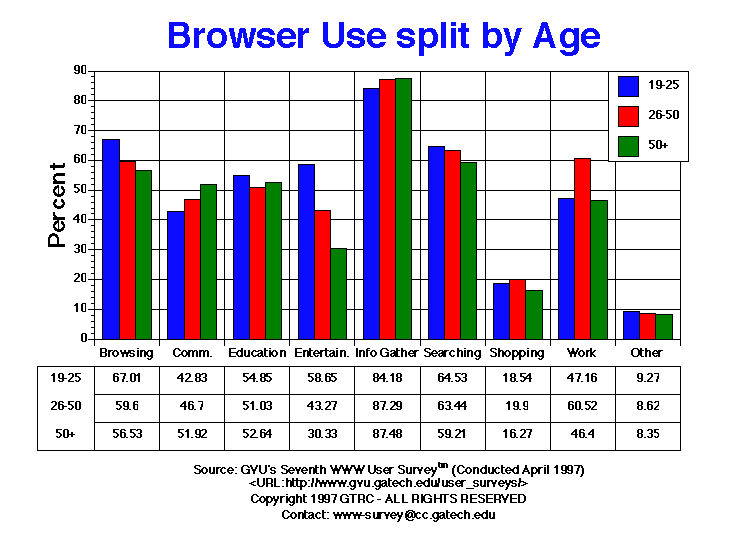
- As with the Fifth Survey, males reported slightly more work-related uses of the Web: work (53.18%) and business research (44.61%) while females reported more educational uses (58.46%). Also mirroring the findings of the Fifth Survey, the 26-50 age group reported significantly more work (58.11%) and business research (47.99%) being done on the Web than other age groups. Those aged 19-25 report more entertainment uses (75.85%) and academic research (51.18%).
Table of Data for All Categories
| Primary Uses of Browser |
All |
Male |
Female |
USA |
Europe |
19-25 |
26-50 |
50+ |
| Browsing |
9992.00 61.29% |
6565.00 59.98% |
3294.00 64.27% |
8080.00 62.71% |
533.00 49.63% |
1995.00 67.01% |
5806.00 59.60% |
1178.00 56.53% |
| Communication |
7665.00 47.02% |
5109.00 46.67% |
2451.00 47.82% |
6115.00 47.46% |
447.00 41.62% |
1275.00 42.83% |
4550.00 46.70% |
1082.00 51.92% |
| Education |
8511.00 52.21% |
5405.00 49.38% |
2991.00 58.36% |
6953.00 53.97% |
409.00 38.08% |
1633.00 54.85% |
4971.00 51.03% |
1097.00 52.64% |
| Entertainment |
7414.00 45.48% |
5022.00 45.88% |
2310.00 45.07% |
6016.00 46.69% |
366.00 34.08% |
1746.00 58.65% |
4215.00 43.27% |
632.00 30.33% |
| Information Gathering |
14026.00 86.03% |
9512.00 86.90% |
4315.00 84.20% |
11165.00 86.66% |
912.00 84.92% |
2506.00 84.18% |
8504.00 87.29% |
1823.00 87.48% |
| Other |
1514.00 9.29% |
1052.00 9.61% |
432.00 8.43% |
1258.00 9.76% |
71.00 6.61% |
276.00 9.27% |
840.00 8.62% |
174.00 8.35% |
| Searching |
10273.00 63.01% |
6834.00 62.43% |
3294.00 64.27% |
8270.00 64.19% |
626.00 58.29% |
1921.00 64.53% |
6180.00 63.44% |
1234.00 59.21% |
| Shopping |
3040.00 18.65% |
2207.00 20.16% |
802.00 15.65% |
2618.00 20.32% |
128.00 11.92% |
552.00 18.54% |
1939.00 19.90% |
339.00 16.27% |
| Work |
8811.00 54.05% |
6290.00 57.46% |
2391.00 46.65% |
7050.00 54.72% |
602.00 56.05% |
1404.00 47.16% |
5896.00 60.52% |
967.00 46.40% |
For more information or to submit comments:
send e-mail to www-survey@cc.gatech.edu.
GVU's WWW Surveying Team
Graphics, Visualization, & Usability Center
College of Computing
Georgia Institute of Technology
Atlanta, GA 30332-0280