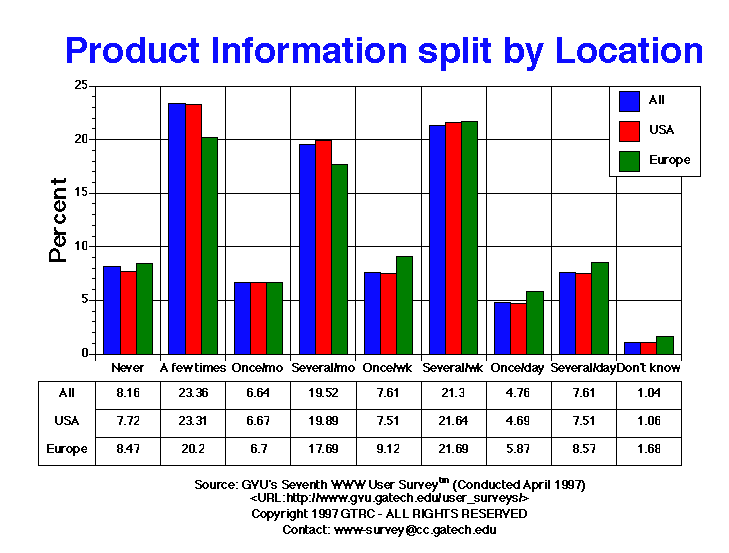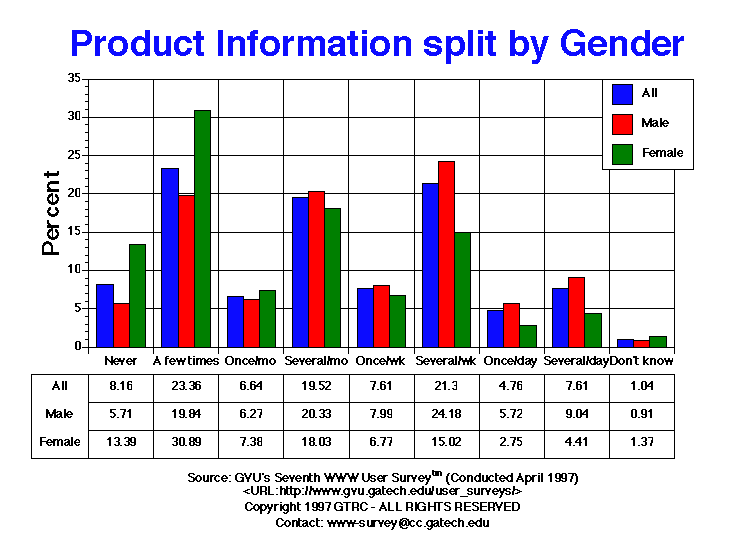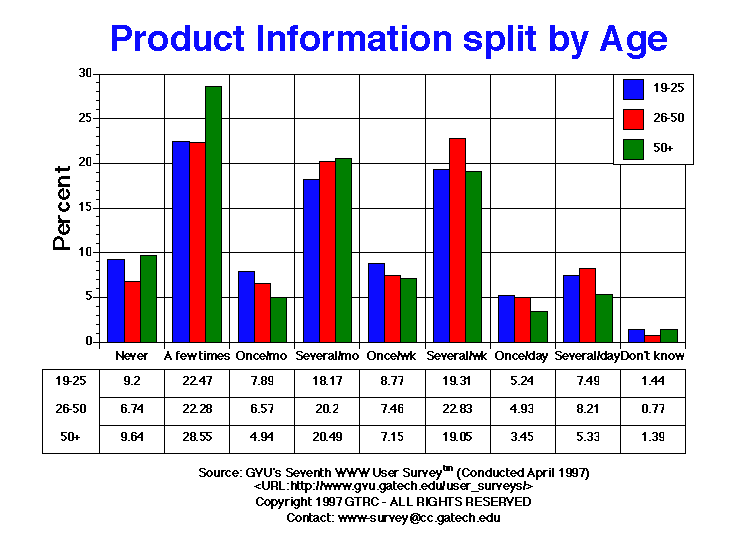

| Product Information | All | Male | Female | USA | Europe | 19-25 | 26-50 | 50+ |
| A few times | 3809.00 23.36% |
2172.00 19.84% |
1583.00 30.89% |
3003.00 23.31% |
217.00 20.20% |
669.00 22.47% |
2171.00 22.28% |
595.00 28.55% |
| Don't know | 170.00 1.04% |
100.00 0.91% |
70.00 1.37% |
136.00 1.06% |
18.00 1.68% |
43.00 1.44% |
75.00 0.77% |
29.00 1.39% |
| Never | 1331.00 8.16% |
625.00 5.71% |
686.00 13.39% |
995.00 7.72% |
91.00 8.47% |
274.00 9.20% |
657.00 6.74% |
201.00 9.64% |
| Once per day | 776.00 4.76% |
626.00 5.72% |
141.00 2.75% |
604.00 4.69% |
63.00 5.87% |
156.00 5.24% |
480.00 4.93% |
72.00 3.45% |
| Once per month | 1082.00 6.64% |
686.00 6.27% |
378.00 7.38% |
860.00 6.67% |
72.00 6.70% |
235.00 7.89% |
640.00 6.57% |
103.00 4.94% |
| Once per week | 1241.00 7.61% |
875.00 7.99% |
347.00 6.77% |
968.00 7.51% |
98.00 9.12% |
261.00 8.77% |
727.00 7.46% |
149.00 7.15% |
| Several times per day | 1240.00 7.61% |
990.00 9.04% |
226.00 4.41% |
968.00 7.51% |
92.00 8.57% |
223.00 7.49% |
800.00 8.21% |
111.00 5.33% |
| Several times per month | 3182.00 19.52% |
2225.00 20.33% |
924.00 18.03% |
2562.00 19.89% |
190.00 17.69% |
541.00 18.17% |
1968.00 20.20% |
427.00 20.49% |
| Several times per week | 3472.00 21.30% |
2647.00 24.18% |
770.00 15.02% |
2788.00 21.64% |
233.00 21.69% |
575.00 19.31% |
2224.00 22.83% |
397.00 19.05% |


GVU's WWW Surveying Team
Graphics, Visualization, & Usability Center
College of Computing
Georgia Institute of Technology
Atlanta, GA 30332-0280