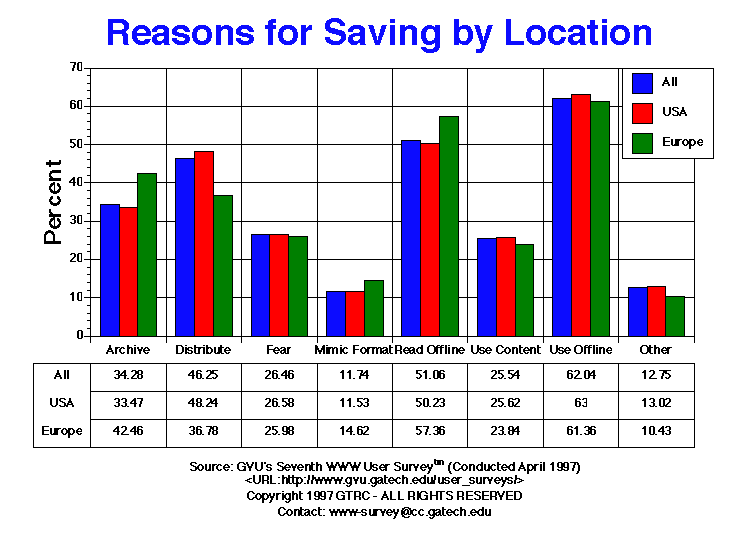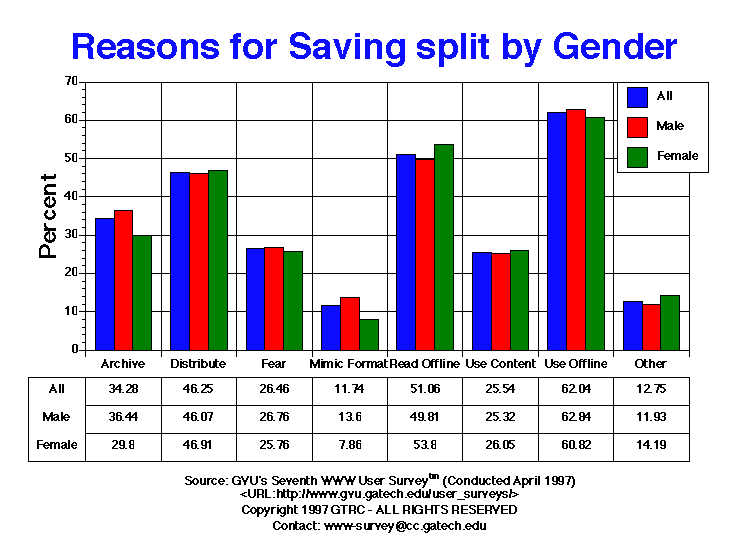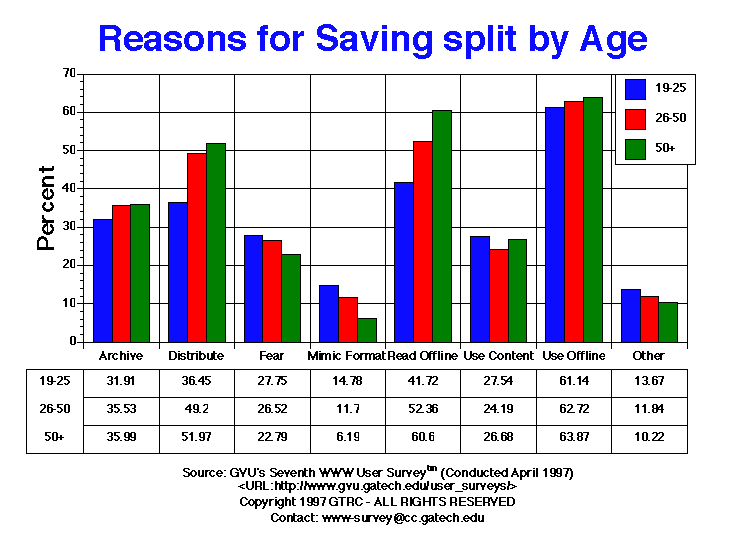

| Reasons For Saving and Printing Documents | All | Male | Female | USA | Europe | 19-25 | 26-50 | 50+ |
| Archive Docs | 5588.00 34.28% |
3989.00 36.44% |
1527.00 29.80% |
4312.00 33.47% |
456.00 42.46% |
950.00 31.91% |
3461.00 35.53% |
750.00 35.99% |
| Distribute to Others Offline | 7540.00 46.25% |
5043.00 46.07% |
2404.00 46.91% |
6215.00 48.24% |
395.00 36.78% |
1085.00 36.45% |
4793.00 49.20% |
1083.00 51.97% |
| Fear Doc Will Dissappear | 4314.00 26.46% |
2929.00 26.76% |
1320.00 25.76% |
3424.00 26.58% |
279.00 25.98% |
826.00 27.75% |
2584.00 26.52% |
475.00 22.79% |
| Mimic Format | 1914.00 11.74% |
1489.00 13.60% |
403.00 7.86% |
1486.00 11.53% |
157.00 14.62% |
440.00 14.78% |
1140.00 11.70% |
129.00 6.19% |
| Other | 2078.00 12.75% |
1306.00 11.93% |
727.00 14.19% |
1678.00 13.02% |
112.00 10.43% |
407.00 13.67% |
1153.00 11.84% |
213.00 10.22% |
| Read Offline | 8325.00 51.06% |
5452.00 49.81% |
2757.00 53.80% |
6472.00 50.23% |
616.00 57.36% |
1242.00 41.72% |
5101.00 52.36% |
1263.00 60.60% |
| Use Content | 4164.00 25.54% |
2771.00 25.32% |
1335.00 26.05% |
3301.00 25.62% |
256.00 23.84% |
820.00 27.54% |
2357.00 24.19% |
556.00 26.68% |
| Use Offline | 10115.00 62.04% |
6878.00 62.84% |
3117.00 60.82% |
8117.00 63.00% |
659.00 61.36% |
1820.00 61.14% |
6110.00 62.72% |
1331.00 63.87% |


GVU's WWW Surveying Team
Graphics, Visualization, & Usability Center
College of Computing
Georgia Institute of Technology
Atlanta, GA 30332-0280