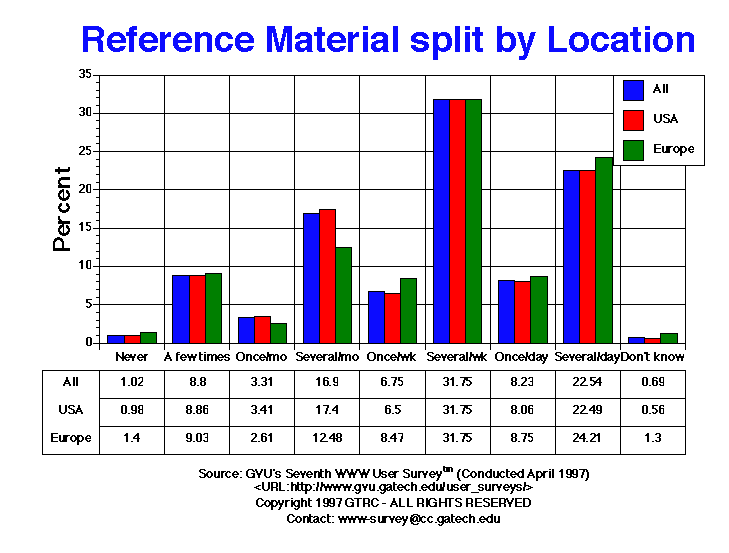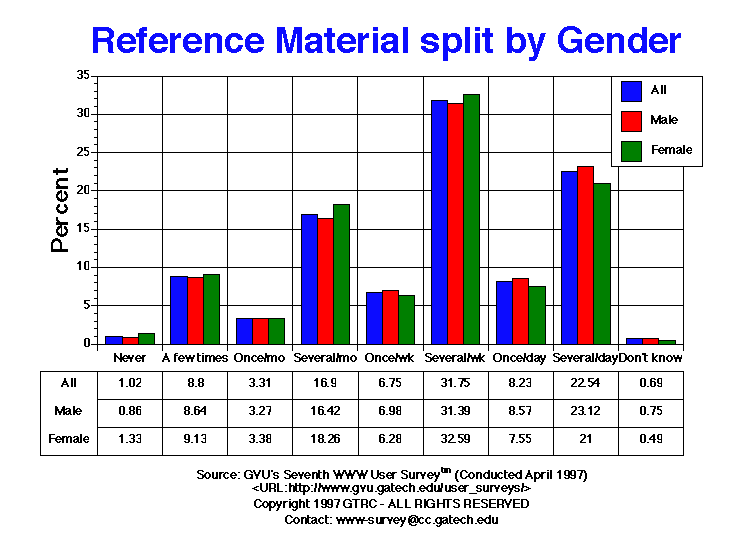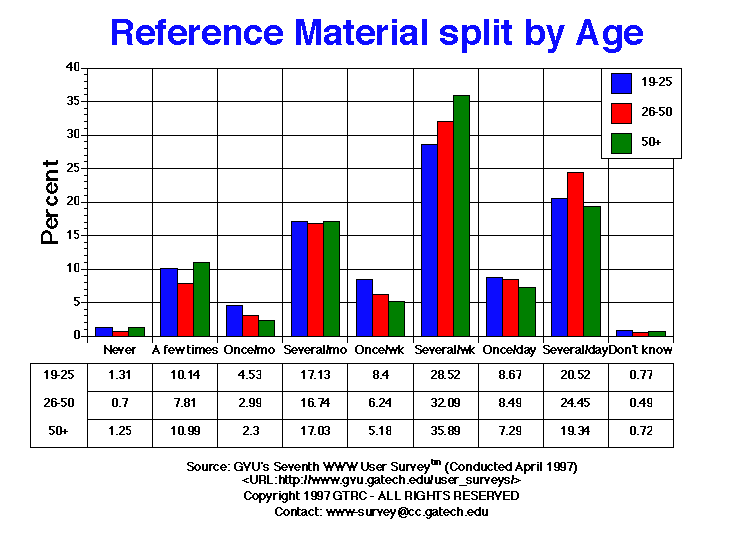

| Reference Material | All | Male | Female | USA | Europe | 19-25 | 26-50 | 50+ |
| A few times | 1434.00 8.80% |
946.00 8.64% |
468.00 9.13% |
1141.00 8.86% |
97.00 9.03% |
302.00 10.14% |
761.00 7.81% |
229.00 10.99% |
| Don't know | 112.00 0.69% |
82.00 0.75% |
25.00 0.49% |
72.00 0.56% |
14.00 1.30% |
23.00 0.77% |
48.00 0.49% |
15.00 0.72% |
| Never | 167.00 1.02% |
94.00 0.86% |
68.00 1.33% |
126.00 0.98% |
15.00 1.40% |
39.00 1.31% |
68.00 0.70% |
26.00 1.25% |
| Once per day | 1342.00 8.23% |
938.00 8.57% |
387.00 7.55% |
1039.00 8.06% |
94.00 8.75% |
258.00 8.67% |
827.00 8.49% |
152.00 7.29% |
| Once per month | 539.00 3.31% |
358.00 3.27% |
173.00 3.38% |
439.00 3.41% |
28.00 2.61% |
135.00 4.53% |
291.00 2.99% |
48.00 2.30% |
| Once per week | 1101.00 6.75% |
764.00 6.98% |
322.00 6.28% |
837.00 6.50% |
91.00 8.47% |
250.00 8.40% |
608.00 6.24% |
108.00 5.18% |
| Several times per day | 3675.00 22.54% |
2531.00 23.12% |
1076.00 21.00% |
2897.00 22.49% |
260.00 24.21% |
611.00 20.52% |
2382.00 24.45% |
403.00 19.34% |
| Several times per month | 2756.00 16.90% |
1797.00 16.42% |
936.00 18.26% |
2242.00 17.40% |
134.00 12.48% |
510.00 17.13% |
1631.00 16.74% |
355.00 17.03% |
| Several times per week | 5177.00 31.75% |
3436.00 31.39% |
1670.00 32.59% |
4091.00 31.75% |
341.00 31.75% |
849.00 28.52% |
3126.00 32.09% |
748.00 35.89% |


GVU's WWW Surveying Team
Graphics, Visualization, & Usability Center
College of Computing
Georgia Institute of Technology
Atlanta, GA 30332-0280