
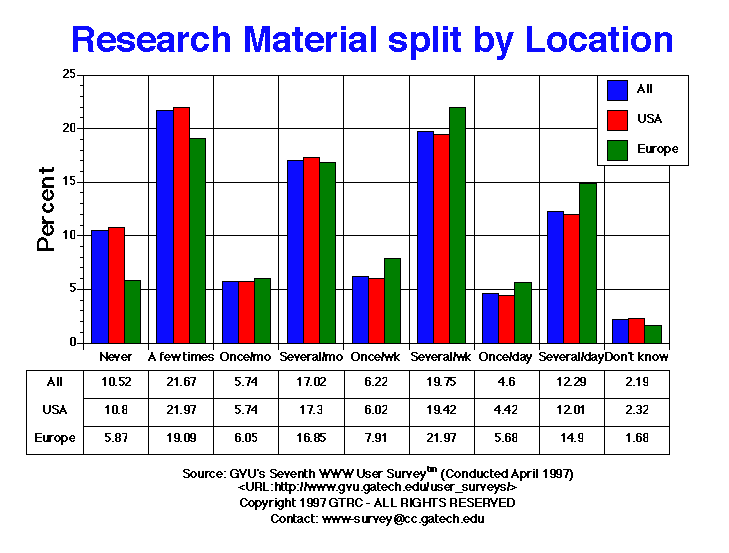
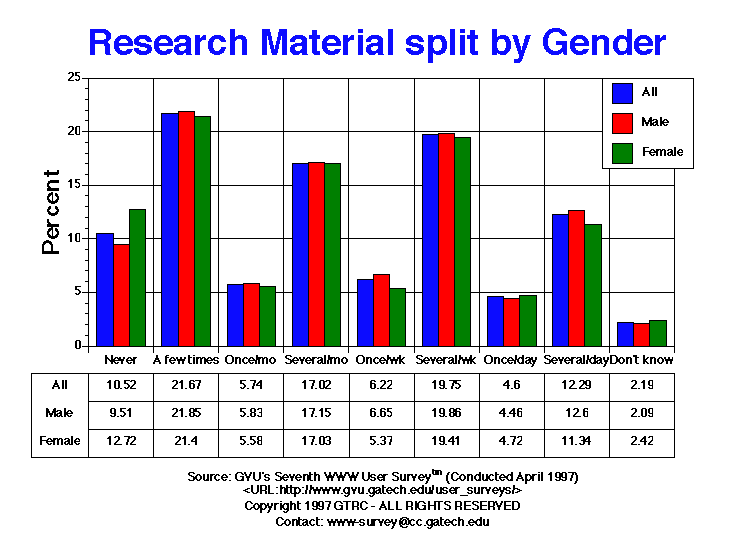
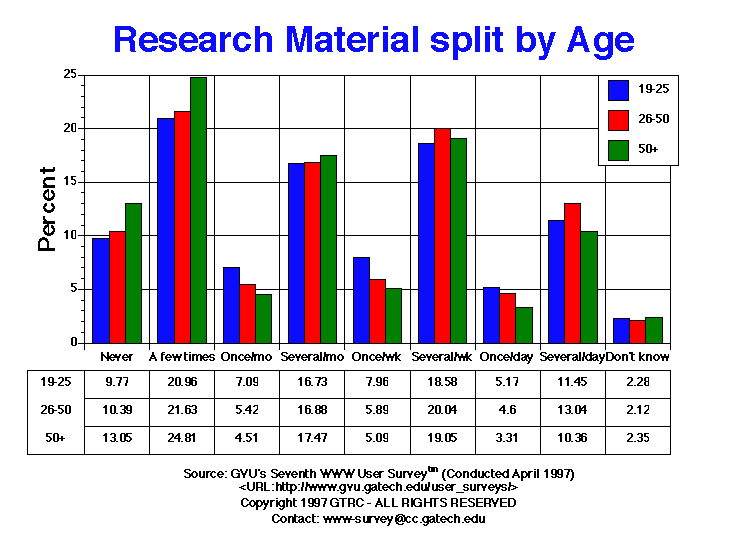
| Research Material | All | Male | Female | USA | Europe | 19-25 | 26-50 | 50+ |
| A few times | 3533.00 21.67% |
2392.00 21.85% |
1097.00 21.40% |
2830.00 21.97% |
205.00 19.09% |
624.00 20.96% |
2107.00 21.63% |
517.00 24.81% |
| Don't know | 357.00 2.19% |
229.00 2.09% |
124.00 2.42% |
299.00 2.32% |
18.00 1.68% |
68.00 2.28% |
207.00 2.12% |
49.00 2.35% |
| Never | 1715.00 10.52% |
1041.00 9.51% |
652.00 12.72% |
1392.00 10.80% |
63.00 5.87% |
291.00 9.77% |
1012.00 10.39% |
272.00 13.05% |
| Once per day | 750.00 4.60% |
488.00 4.46% |
242.00 4.72% |
570.00 4.42% |
61.00 5.68% |
154.00 5.17% |
448.00 4.60% |
69.00 3.31% |
| Once per month | 936.00 5.74% |
638.00 5.83% |
286.00 5.58% |
739.00 5.74% |
65.00 6.05% |
211.00 7.09% |
528.00 5.42% |
94.00 4.51% |
| Once per week | 1014.00 6.22% |
728.00 6.65% |
275.00 5.37% |
776.00 6.02% |
85.00 7.91% |
237.00 7.96% |
574.00 5.89% |
106.00 5.09% |
| Several times per day | 2003.00 12.29% |
1379.00 12.60% |
581.00 11.34% |
1547.00 12.01% |
160.00 14.90% |
341.00 11.45% |
1270.00 13.04% |
216.00 10.36% |
| Several times per month | 2775.00 17.02% |
1877.00 17.15% |
873.00 17.03% |
2229.00 17.30% |
181.00 16.85% |
498.00 16.73% |
1644.00 16.88% |
364.00 17.47% |
| Several times per week | 3220.00 19.75% |
2174.00 19.86% |
995.00 19.41% |
2502.00 19.42% |
236.00 21.97% |
553.00 18.58% |
1952.00 20.04% |
397.00 19.05% |
GVU's WWW Surveying Team
Graphics, Visualization, & Usability Center
College of Computing
Georgia Institute of Technology
Atlanta, GA 30332-0280