
| Shopping | All | Male | Female | USA | Europe | 19-25 | 26-50 | 50+ |
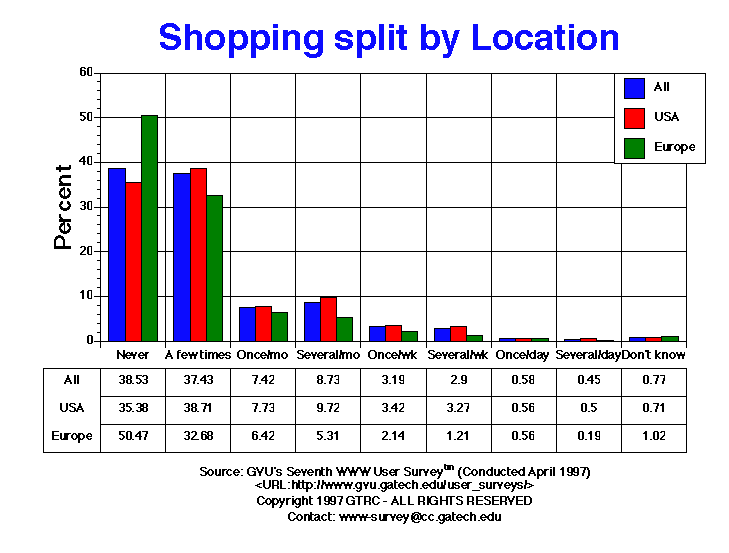
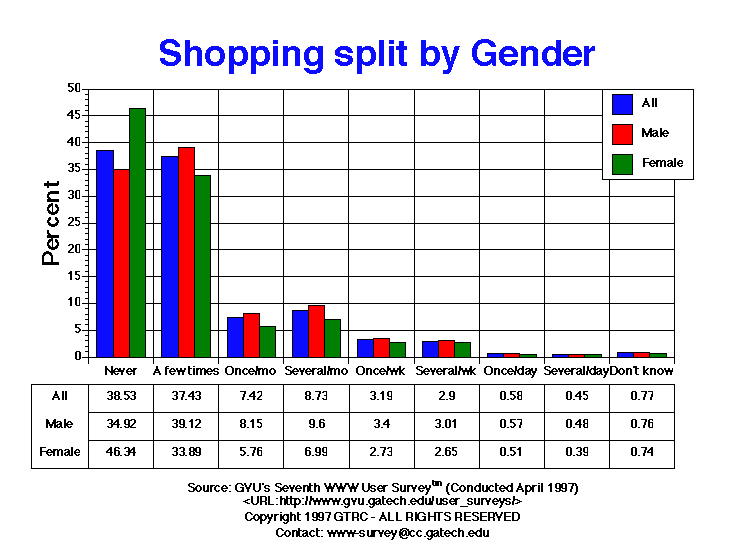
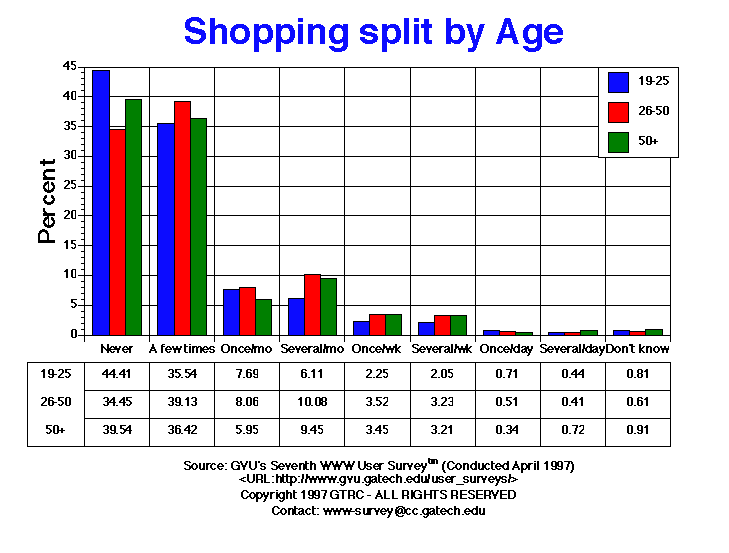
| A few times | 6103.00 37.43% |
4282.00 39.12% |
1737.00 33.89% |
4987.00 38.71% |
351.00 32.68% |
1058.00 35.54% |
3812.00 39.13% |
759.00 36.42% |
| Don't know | 126.00 0.77% |
83.00 0.76% |
38.00 0.74% |
91.00 0.71% |
11.00 1.02% |
24.00 0.81% |
59.00 0.61% |
19.00 0.91% |
| Never | 6281.00 38.53% |
3822.00 34.92% |
2375.00 46.34% |
4559.00 35.38% |
542.00 50.47% |
1322.00 44.41% |
3356.00 34.45% |
824.00 39.54% |
| Once per day | 94.00 0.58% |
62.00 0.57% |
26.00 0.51% |
72.00 0.56% |
6.00 0.56% |
21.00 0.71% |
50.00 0.51% |
7.00 0.34% |
| Once per month | 1209.00 7.42% |
892.00 8.15% |
295.00 5.76% |
996.00 7.73% |
69.00 6.42% |
229.00 7.69% |
785.00 8.06% |
124.00 5.95% |
| Once per week | 520.00 3.19% |
372.00 3.40% |
140.00 2.73% |
441.00 3.42% |
23.00 2.14% |
67.00 2.25% |
343.00 3.52% |
72.00 3.45% |
| Several times per day | 74.00 0.45% |
52.00 0.48% |
20.00 0.39% |
65.00 0.50% |
2.00 0.19% |
13.00 0.44% |
40.00 0.41% |
15.00 0.72% |
| Several times per month | 1423.00 8.73% |
1051.00 9.60% |
358.00 6.99% |
1252.00 9.72% |
57.00 5.31% |
182.00 6.11% |
982.00 10.08% |
197.00 9.45% |
| Several times per week | 473.00 2.90% |
330.00 3.01% |
136.00 2.65% |
421.00 3.27% |
13.00 1.21% |
61.00 2.05% |
315.00 3.23% |
67.00 3.21% |
GVU's WWW Surveying Team
Graphics, Visualization, & Usability Center
College of Computing
Georgia Institute of Technology
Atlanta, GA 30332-0280