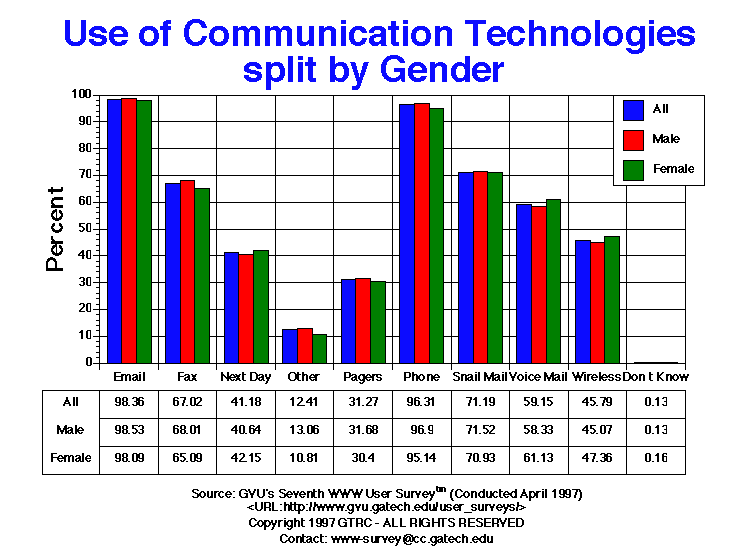

| Use of Communication Technologies | All | Male | Female | USA | Europe | 19-25 | 26-50 | 50+ |
| Don t Know | 22.00 0.13% |
14.00 0.13% |
8.00 0.16% |
17.00 0.13% |
2.00 0.19% |
3.00 0.10% |
12.00 0.12% |
1.00 0.05% |
| 16036.00 98.36% |
10785.00 98.53% |
5027.00 98.09% |
12689.00 98.49% |
1056.00 98.32% |
2932.00 98.49% |
9601.00 98.55% |
2051.00 98.42% |
|
| Fax | 10926.00 67.02% |
7444.00 68.01% |
3336.00 65.09% |
8581.00 66.60% |
721.00 67.13% |
1552.00 52.13% |
7134.00 73.23% |
1480.00 71.02% |
| Next Day Mail | 6713.00 41.18% |
4449.00 40.64% |
2160.00 42.15% |
5640.00 43.78% |
288.00 26.82% |
941.00 31.61% |
4333.00 44.48% |
904.00 43.38% |
| Other | 2024.00 12.41% |
1430.00 13.06% |
554.00 10.81% |
1601.00 12.43% |
134.00 12.48% |
425.00 14.28% |
1095.00 11.24% |
173.00 8.30% |
| Pagers | 5098.00 31.27% |
3468.00 31.68% |
1558.00 30.40% |
4470.00 34.69% |
155.00 14.43% |
1008.00 33.86% |
3174.00 32.58% |
473.00 22.70% |
| Phone | 15701.00 96.31% |
10607.00 96.90% |
4876.00 95.14% |
12453.00 96.65% |
1016.00 94.60% |
2853.00 95.83% |
9416.00 96.65% |
2015.00 96.69% |
| Snail Mail | 11606.00 71.19% |
7829.00 71.52% |
3635.00 70.93% |
9511.00 73.82% |
581.00 54.10% |
1898.00 63.76% |
7154.00 73.43% |
1659.00 79.61% |
| Voice Mail | 9643.00 59.15% |
6385.00 58.33% |
3133.00 61.13% |
8286.00 64.31% |
262.00 24.39% |
1675.00 56.26% |
6276.00 64.42% |
1017.00 48.80% |
| Wireless Phone | 7465.00 45.79% |
4933.00 45.07% |
2427.00 47.36% |
5980.00 46.41% |
440.00 40.97% |
1203.00 40.41% |
4628.00 47.51% |
914.00 43.86% |


GVU's WWW Surveying Team
Graphics, Visualization, & Usability Center
College of Computing
Georgia Institute of Technology
Atlanta, GA 30332-0280