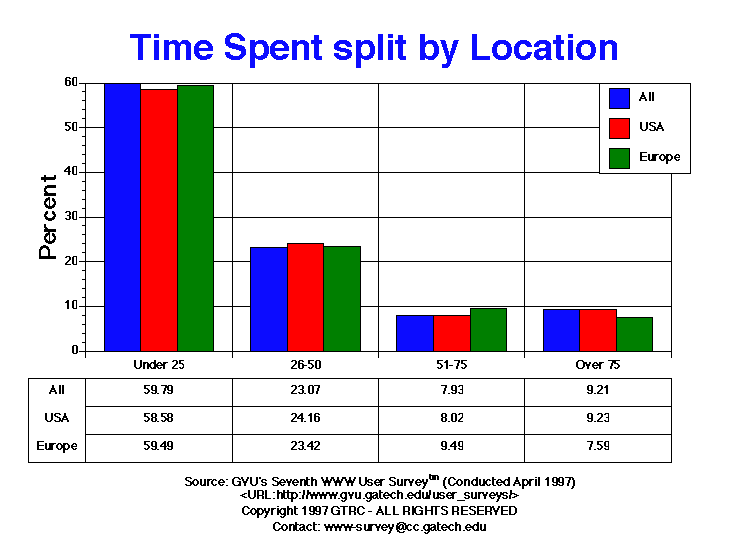

| Time Spent Being Webmaster | All | USA | Europe |
| 26-50 | 358.00 23.07% |
280.00 24.16% |
37.00 23.42% |
| 51-75 | 123.00 7.93% |
93.00 8.02% |
15.00 9.49% |
| Over 75 | 143.00 9.21% |
107.00 9.23% |
12.00 7.59% |
| Under 25 | 928.00 59.79% |
679.00 58.58% |
94.00 59.49% |

GVU's WWW Surveying Team
Graphics, Visualization, & Usability Center
College of Computing
Georgia Institute of Technology
Atlanta, GA 30332-0280