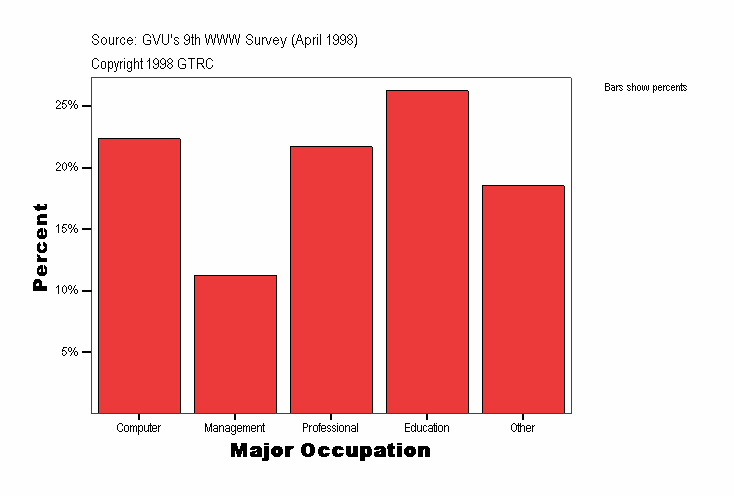
Major Occupation
|
Frequency |
Percent |
Valid Percent |
Cumulative Percent |
|---|
| Valid |
Computer |
2811
| 22.3
| 22.3
| 22.3
|
|---|
| Management |
1415
| 11.2
| 11.2
| 33.6
|
|---|
| Professional |
2731
| 21.7
| 21.7
| 55.3
|
|---|
| Education |
3304
| 26.2
| 26.2
| 81.5
|
|---|
| Other |
2330
| 18.5
| 18.5
| 100.0
|
|---|
| Total |
12591
| 100.0
| 100.0
|
|
|---|
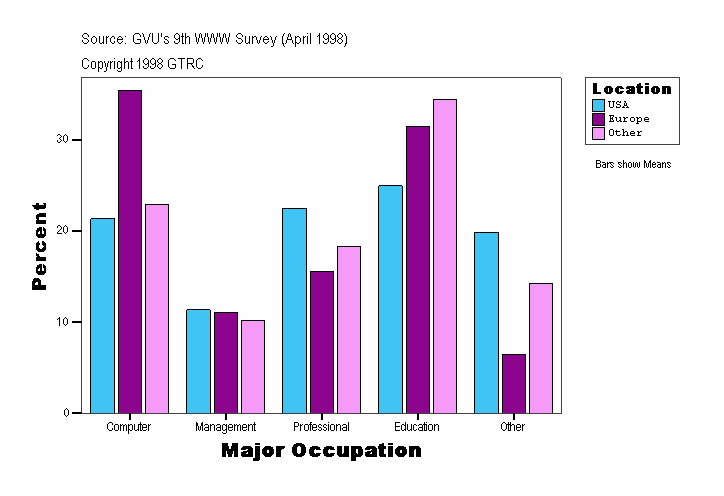
Major Occupation
| Location |
Frequency |
Percent |
Valid Percent |
Cumulative Percent |
|---|
| USA |
Valid |
Computer |
2269
| 21.4
| 21.4
| 21.4
|
|---|
| Management |
1208
| 11.4
| 11.4
| 32.7
|
|---|
| Professional |
2391
| 22.5
| 22.5
| 55.2
|
|---|
| Education |
2649
| 24.9
| 24.9
| 80.2
|
|---|
| Other |
2107
| 19.8
| 19.8
| 100.0
|
|---|
| Total |
10624
| 100.0
| 100.0
|
|
|---|
| Europe |
Valid |
Computer |
259
| 35.4
| 35.4
| 35.4
|
|---|
| Management |
81
| 11.1
| 11.1
| 46.5
|
|---|
| Professional |
114
| 15.6
| 15.6
| 62.1
|
|---|
| Education |
230
| 31.5
| 31.5
| 93.6
|
|---|
| Other |
47
| 6.4
| 6.4
| 100.0
|
|---|
| Total |
731
| 100.0
| 100.0
|
|
|---|
| Other |
Valid |
Computer |
283
| 22.9
| 22.9
| 22.9
|
|---|
| Management |
126
| 10.2
| 10.2
| 33.1
|
|---|
| Professional |
226
| 18.3
| 18.3
| 51.4
|
|---|
| Education |
425
| 34.4
| 34.4
| 85.8
|
|---|
| Other |
176
| 14.2
| 14.2
| 100.0
|
|---|
| Total |
1236
| 100.0
| 100.0
|
|
|---|
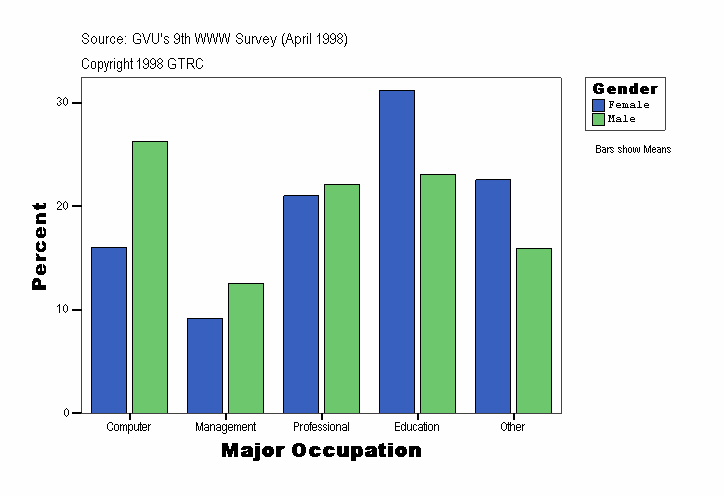
Major Occupation
| Gender |
Frequency |
Percent |
Valid Percent |
Cumulative Percent |
|---|
| Female |
Valid |
Computer |
782
| 16.0
| 16.0
| 16.0
|
|---|
| Management |
447
| 9.2
| 9.2
| 25.2
|
|---|
| Professional |
1025
| 21.0
| 21.0
| 46.2
|
|---|
| Education |
1521
| 31.2
| 31.2
| 77.4
|
|---|
| Other |
1100
| 22.6
| 22.6
| 100.0
|
|---|
| Total |
4875
| 100.0
| 100.0
|
|
|---|
| Male |
Valid |
Computer |
2029
| 26.3
| 26.3
| 26.3
|
|---|
| Management |
968
| 12.5
| 12.5
| 38.8
|
|---|
| Professional |
1706
| 22.1
| 22.1
| 61.0
|
|---|
| Education |
1783
| 23.1
| 23.1
| 84.1
|
|---|
| Other |
1230
| 15.9
| 15.9
| 100.0
|
|---|
| Total |
7716
| 100.0
| 100.0
|
|
|---|
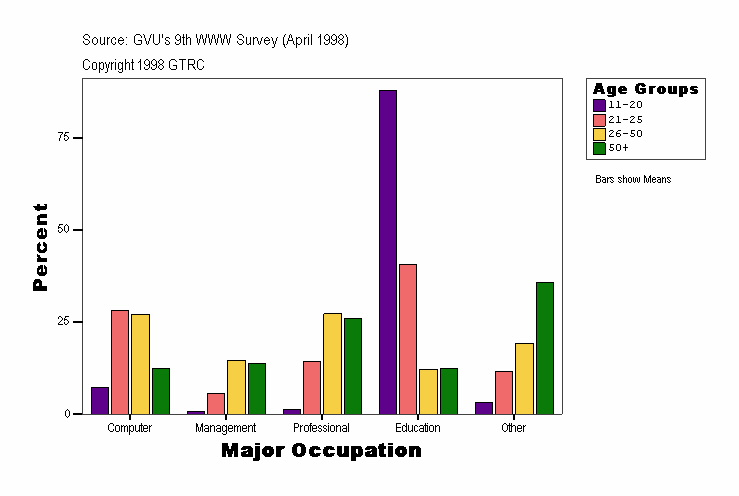
Major Occupation
| Age Groups |
Frequency |
Percent |
Valid Percent |
Cumulative Percent |
|---|
| . |
Valid |
Management |
4
| 28.6
| 28.6
| 28.6
|
|---|
| Professional |
2
| 14.3
| 14.3
| 42.9
|
|---|
| Education |
5
| 35.7
| 35.7
| 78.6
|
|---|
| Other |
3
| 21.4
| 21.4
| 100.0
|
|---|
| Total |
14
| 100.0
| 100.0
|
|
|---|
| 11-20 |
Valid |
Computer |
119
| 7.3
| 7.3
| 7.3
|
|---|
| Management |
10
| .6
| .6
| 7.9
|
|---|
| Professional |
22
| 1.4
| 1.4
| 9.3
|
|---|
| Education |
1426
| 87.6
| 87.6
| 96.9
|
|---|
| Other |
50
| 3.1
| 3.1
| 100.0
|
|---|
| Total |
1627
| 100.0
| 100.0
|
|
|---|
| 21-25 |
Valid |
Computer |
537
| 28.1
| 28.1
| 28.1
|
|---|
| Management |
104
| 5.4
| 5.4
| 33.5
|
|---|
| Professional |
273
| 14.3
| 14.3
| 47.8
|
|---|
| Education |
777
| 40.7
| 40.7
| 88.5
|
|---|
| Other |
220
| 11.5
| 11.5
| 100.0
|
|---|
| Total |
1911
| 100.0
| 100.0
|
|
|---|
| 26-50 |
Valid |
Computer |
1914
| 27.0
| 27.0
| 27.0
|
|---|
| Management |
1029
| 14.5
| 14.5
| 41.5
|
|---|
| Professional |
1930
| 27.2
| 27.2
| 68.7
|
|---|
| Education |
858
| 12.1
| 12.1
| 80.8
|
|---|
| Other |
1362
| 19.2
| 19.2
| 100.0
|
|---|
| Total |
7093
| 100.0
| 100.0
|
|
|---|
| 50+ |
Valid |
Computer |
241
| 12.4
| 12.4
| 12.4
|
|---|
| Management |
268
| 13.8
| 13.8
| 26.2
|
|---|
| Professional |
504
| 25.9
| 25.9
| 52.1
|
|---|
| Education |
238
| 12.2
| 12.2
| 64.3
|
|---|
| Other |
695
| 35.7
| 35.7
| 100.0
|
|---|
| Total |
1946
| 100.0
| 100.0
|
|
|---|
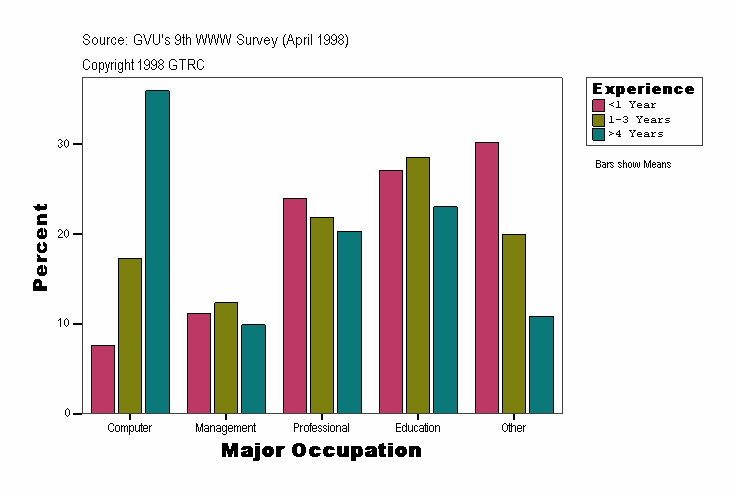
Major Occupation
| Experience |
Frequency |
Percent |
Valid Percent |
Cumulative Percent |
|---|
| <1 Year |
Valid |
Computer |
177
| 7.6
| 7.6
| 7.6
|
|---|
| Management |
260
| 11.2
| 11.2
| 18.8
|
|---|
| Professional |
556
| 24.0
| 24.0
| 42.8
|
|---|
| Education |
627
| 27.0
| 27.0
| 69.9
|
|---|
| Other |
699
| 30.1
| 30.1
| 100.0
|
|---|
| Total |
2319
| 100.0
| 100.0
|
|
|---|
| 1-3 Years |
Valid |
Computer |
977
| 17.3
| 17.3
| 17.3
|
|---|
| Management |
699
| 12.3
| 12.3
| 29.6
|
|---|
| Professional |
1239
| 21.9
| 21.9
| 51.5
|
|---|
| Education |
1615
| 28.5
| 28.5
| 80.0
|
|---|
| Other |
1131
| 20.0
| 20.0
| 100.0
|
|---|
| Total |
5661
| 100.0
| 100.0
|
|
|---|
| >4 Years |
Valid |
Computer |
1657
| 35.9
| 35.9
| 35.9
|
|---|
| Management |
456
| 9.9
| 9.9
| 45.8
|
|---|
| Professional |
936
| 20.3
| 20.3
| 66.1
|
|---|
| Education |
1062
| 23.0
| 23.0
| 89.2
|
|---|
| Other |
500
| 10.8
| 10.8
| 100.0
|
|---|
| Total |
4611
| 100.0
| 100.0
|
|
|---|
Source: GVU's Ninth WWW User Survey (Conducted April 1998)
URL:http://www.gvu.gatech.edu/user_surveys/
Copyright 1998 GTRC - ALL RIGHTS RESERVED
Contact: www-survey@cc.gatech.edu
For more information or to submit comments:
send email to www-survey@cc.gatech.edu.
GVU's WWW Surveying Team
Graphics, Visualization, & Usability Center
College of Computing
Georgia Institute of Technology
Atlanta, GA 30332-0280
