
[Back to Ninth Survey Home | Back to Ninth Survey Graphs]
| Frequency | Percent | Valid Percent | Cumulative Percent | ||
|---|---|---|---|---|---|
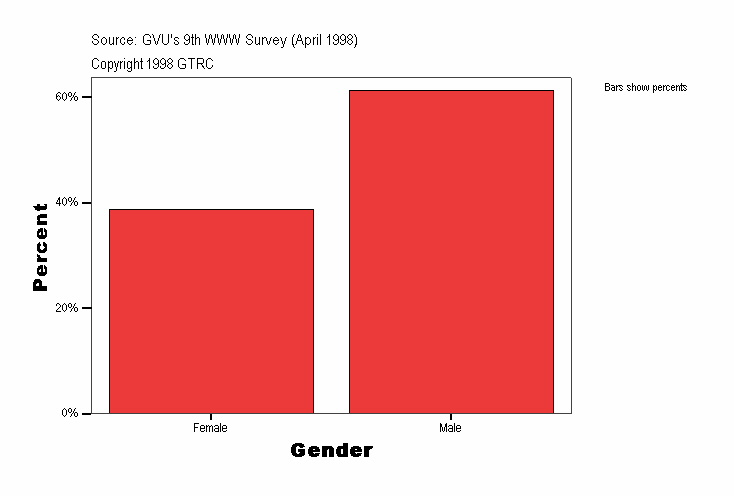
| Valid | Female | 4875 | 38.7 | 38.7 | 38.7 |
| Male | 7716 | 61.3 | 61.3 | 100.0 | |
| Total | 12591 | 100.0 | 100.0 | ||
| Location | Frequency | Percent | Valid Percent | Cumulative Percent | ||
|---|---|---|---|---|---|---|
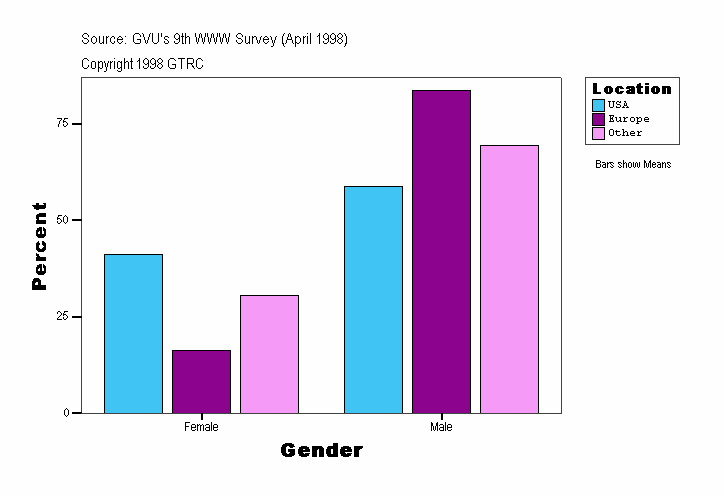
| USA | Valid | Female | 4379 | 41.2 | 41.2 | 41.2 |
| Male | 6245 | 58.8 | 58.8 | 100.0 | ||
| Total | 10624 | 100.0 | 100.0 | |||
| Europe | Valid | Female | 119 | 16.3 | 16.3 | 16.3 |
| Male | 612 | 83.7 | 83.7 | 100.0 | ||
| Total | 731 | 100.0 | 100.0 | |||
| Other | Valid | Female | 377 | 30.5 | 30.5 | 30.5 |
| Male | 859 | 69.5 | 69.5 | 100.0 | ||
| Total | 1236 | 100.0 | 100.0 | |||
| Age Groups | Frequency | Percent | Valid Percent | Cumulative Percent | ||
|---|---|---|---|---|---|---|
| . | Valid | Female | 7 | 50.0 | 50.0 | 50.0 |
| Male | 7 | 50.0 | 50.0 | 100.0 | ||
| Total | 14 | 100.0 | 100.0 | |||
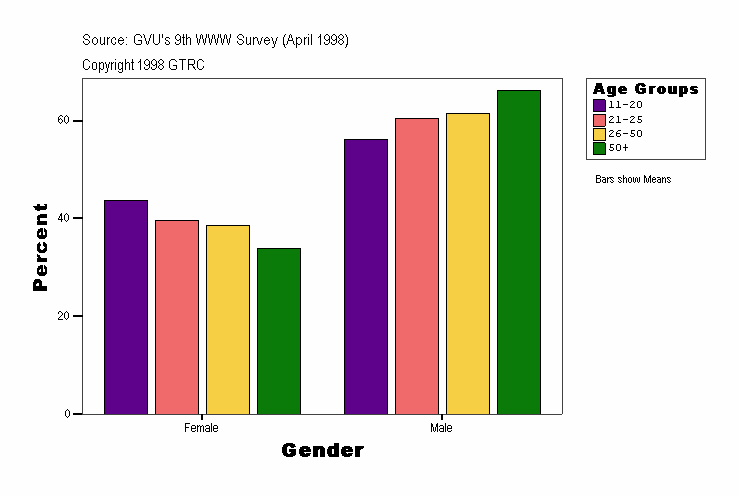
| 11-20 | Valid | Female | 712 | 43.8 | 43.8 | 43.8 |
| Male | 915 | 56.2 | 56.2 | 100.0 | ||
| Total | 1627 | 100.0 | 100.0 | |||
| 21-25 | Valid | Female | 757 | 39.6 | 39.6 | 39.6 |
| Male | 1154 | 60.4 | 60.4 | 100.0 | ||
| Total | 1911 | 100.0 | 100.0 | |||
| 26-50 | Valid | Female | 2739 | 38.6 | 38.6 | 38.6 |
| Male | 4354 | 61.4 | 61.4 | 100.0 | ||
| Total | 7093 | 100.0 | 100.0 | |||
| 50+ | Valid | Female | 660 | 33.9 | 33.9 | 33.9 |
| Male | 1286 | 66.1 | 66.1 | 100.0 | ||
| Total | 1946 | 100.0 | 100.0 | |||
| Experience | Frequency | Percent | Valid Percent | Cumulative Percent | ||
|---|---|---|---|---|---|---|
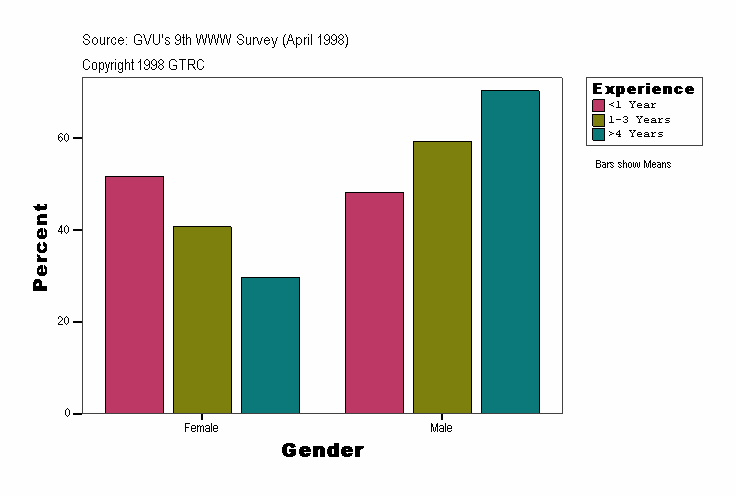
| <1 Year | Valid | Female | 1200 | 51.7 | 51.7 | 51.7 |
| Male | 1119 | 48.3 | 48.3 | 100.0 | ||
| Total | 2319 | 100.0 | 100.0 | |||
| 1-3 Years | Valid | Female | 2305 | 40.7 | 40.7 | 40.7 |
| Male | 3356 | 59.3 | 59.3 | 100.0 | ||
| Total | 5661 | 100.0 | 100.0 | |||
| >4 Years | Valid | Female | 1370 | 29.7 | 29.7 | 29.7 |
| Male | 3241 | 70.3 | 70.3 | 100.0 | ||
| Total | 4611 | 100.0 | 100.0 | |||
For more information or to submit comments:
send email to www-survey@cc.gatech.edu.
GVU's WWW Surveying Team
Graphics, Visualization, & Usability Center
College of Computing
Georgia Institute of Technology
Atlanta, GA 30332-0280