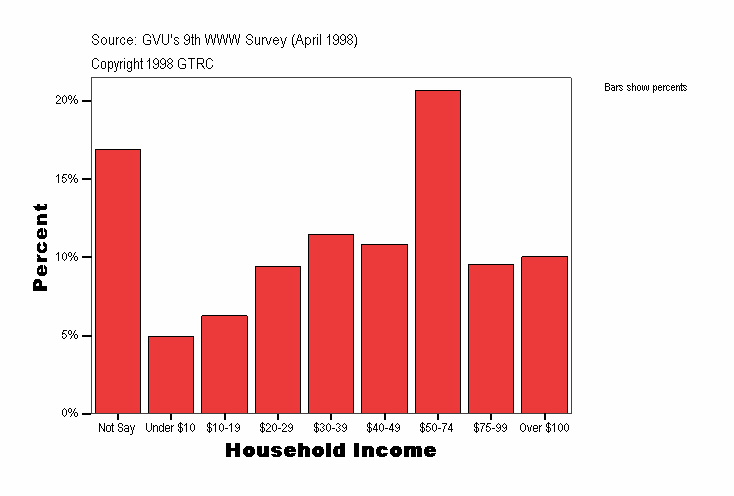
Household Income
|
Frequency |
Percent |
Valid Percent |
Cumulative Percent |
|---|
| Valid |
Not Say |
2126
| 16.9
| 16.9
| 16.9
|
|---|
| Under $10 |
620
| 4.9
| 4.9
| 21.8
|
|---|
| $10-19 |
788
| 6.3
| 6.3
| 28.1
|
|---|
| $20-29 |
1184
| 9.4
| 9.4
| 37.5
|
|---|
| $30-39 |
1440
| 11.4
| 11.4
| 48.9
|
|---|
| $40-49 |
1366
| 10.8
| 10.8
| 59.8
|
|---|
| $50-74 |
2600
| 20.6
| 20.6
| 80.4
|
|---|
| $75-99 |
1203
| 9.6
| 9.6
| 90.0
|
|---|
| Over $100 |
1264
| 10.0
| 10.0
| 100.0
|
|---|
| Total |
12591
| 100.0
| 100.0
|
|
|---|
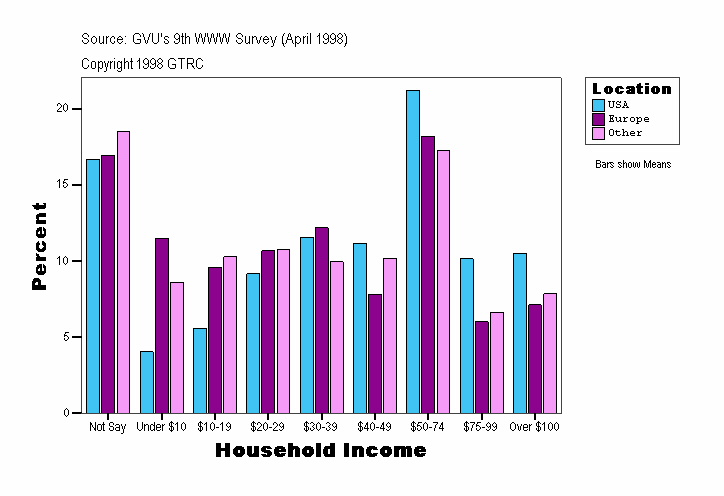
Household Income
| Location |
Frequency |
Percent |
Valid Percent |
Cumulative Percent |
|---|
| USA |
Valid |
Not Say |
1773
| 16.7
| 16.7
| 16.7
|
|---|
| Under $10 |
430
| 4.0
| 4.0
| 20.7
|
|---|
| $10-19 |
591
| 5.6
| 5.6
| 26.3
|
|---|
| $20-29 |
973
| 9.2
| 9.2
| 35.5
|
|---|
| $30-39 |
1228
| 11.6
| 11.6
| 47.0
|
|---|
| $40-49 |
1183
| 11.1
| 11.1
| 58.2
|
|---|
| $50-74 |
2254
| 21.2
| 21.2
| 79.4
|
|---|
| $75-99 |
1077
| 10.1
| 10.1
| 89.5
|
|---|
| Over $100 |
1115
| 10.5
| 10.5
| 100.0
|
|---|
| Total |
10624
| 100.0
| 100.0
|
|
|---|
| Europe |
Valid |
Not Say |
124
| 17.0
| 17.0
| 17.0
|
|---|
| Under $10 |
84
| 11.5
| 11.5
| 28.5
|
|---|
| $10-19 |
70
| 9.6
| 9.6
| 38.0
|
|---|
| $20-29 |
78
| 10.7
| 10.7
| 48.7
|
|---|
| $30-39 |
89
| 12.2
| 12.2
| 60.9
|
|---|
| $40-49 |
57
| 7.8
| 7.8
| 68.7
|
|---|
| $50-74 |
133
| 18.2
| 18.2
| 86.9
|
|---|
| $75-99 |
44
| 6.0
| 6.0
| 92.9
|
|---|
| Over $100 |
52
| 7.1
| 7.1
| 100.0
|
|---|
| Total |
731
| 100.0
| 100.0
|
|
|---|
| Other |
Valid |
Not Say |
229
| 18.5
| 18.5
| 18.5
|
|---|
| Under $10 |
106
| 8.6
| 8.6
| 27.1
|
|---|
| $10-19 |
127
| 10.3
| 10.3
| 37.4
|
|---|
| $20-29 |
133
| 10.8
| 10.8
| 48.1
|
|---|
| $30-39 |
123
| 10.0
| 10.0
| 58.1
|
|---|
| $40-49 |
126
| 10.2
| 10.2
| 68.3
|
|---|
| $50-74 |
213
| 17.2
| 17.2
| 85.5
|
|---|
| $75-99 |
82
| 6.6
| 6.6
| 92.2
|
|---|
| Over $100 |
97
| 7.8
| 7.8
| 100.0
|
|---|
| Total |
1236
| 100.0
| 100.0
|
|
|---|
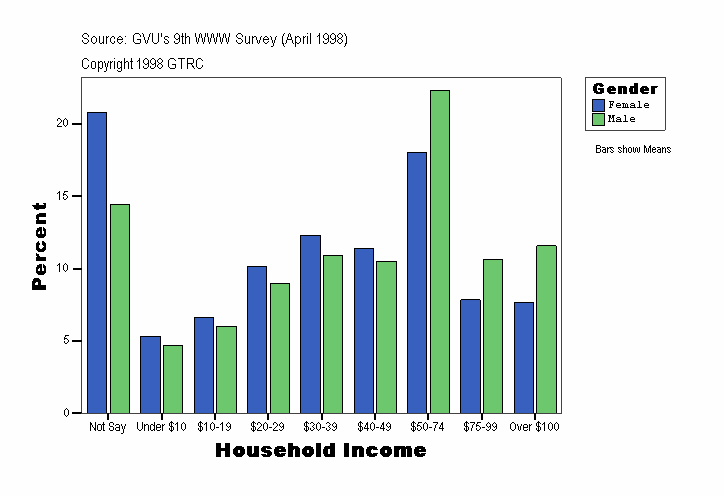
Household Income
| Gender |
Frequency |
Percent |
Valid Percent |
Cumulative Percent |
|---|
| Female |
Valid |
Not Say |
1012
| 20.8
| 20.8
| 20.8
|
|---|
| Under $10 |
259
| 5.3
| 5.3
| 26.1
|
|---|
| $10-19 |
324
| 6.6
| 6.6
| 32.7
|
|---|
| $20-29 |
493
| 10.1
| 10.1
| 42.8
|
|---|
| $30-39 |
600
| 12.3
| 12.3
| 55.1
|
|---|
| $40-49 |
555
| 11.4
| 11.4
| 66.5
|
|---|
| $50-74 |
878
| 18.0
| 18.0
| 84.5
|
|---|
| $75-99 |
382
| 7.8
| 7.8
| 92.4
|
|---|
| Over $100 |
372
| 7.6
| 7.6
| 100.0
|
|---|
| Total |
4875
| 100.0
| 100.0
|
|
|---|
| Male |
Valid |
Not Say |
1114
| 14.4
| 14.4
| 14.4
|
|---|
| Under $10 |
361
| 4.7
| 4.7
| 19.1
|
|---|
| $10-19 |
464
| 6.0
| 6.0
| 25.1
|
|---|
| $20-29 |
691
| 9.0
| 9.0
| 34.1
|
|---|
| $30-39 |
840
| 10.9
| 10.9
| 45.0
|
|---|
| $40-49 |
811
| 10.5
| 10.5
| 55.5
|
|---|
| $50-74 |
1722
| 22.3
| 22.3
| 77.8
|
|---|
| $75-99 |
821
| 10.6
| 10.6
| 88.4
|
|---|
| Over $100 |
892
| 11.6
| 11.6
| 100.0
|
|---|
| Total |
7716
| 100.0
| 100.0
|
|
|---|
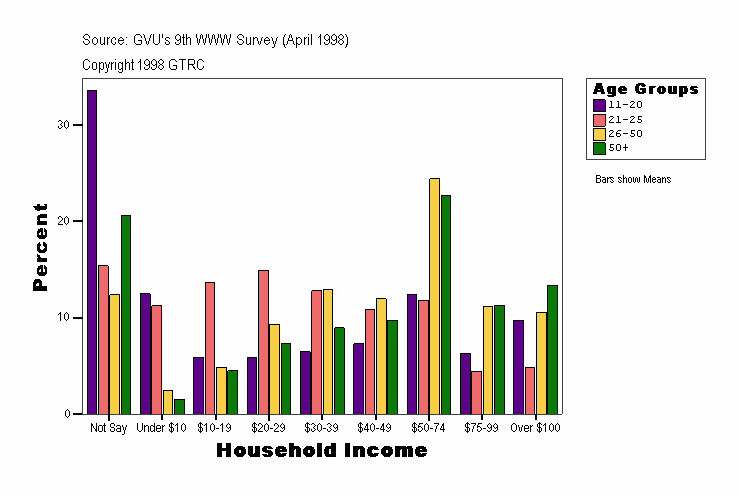
Household Income
| Age Groups |
Frequency |
Percent |
Valid Percent |
Cumulative Percent |
|---|
| . |
Valid |
Not Say |
7
| 50.0
| 50.0
| 50.0
|
|---|
| Under $10 |
2
| 14.3
| 14.3
| 64.3
|
|---|
| $75-99 |
1
| 7.1
| 7.1
| 71.4
|
|---|
| Over $100 |
4
| 28.6
| 28.6
| 100.0
|
|---|
| Total |
14
| 100.0
| 100.0
|
|
|---|
| 11-20 |
Valid |
Not Say |
546
| 33.6
| 33.6
| 33.6
|
|---|
| Under $10 |
203
| 12.5
| 12.5
| 46.0
|
|---|
| $10-19 |
96
| 5.9
| 5.9
| 51.9
|
|---|
| $20-29 |
96
| 5.9
| 5.9
| 57.8
|
|---|
| $30-39 |
105
| 6.5
| 6.5
| 64.3
|
|---|
| $40-49 |
119
| 7.3
| 7.3
| 71.6
|
|---|
| $50-74 |
202
| 12.4
| 12.4
| 84.0
|
|---|
| $75-99 |
102
| 6.3
| 6.3
| 90.3
|
|---|
| Over $100 |
158
| 9.7
| 9.7
| 100.0
|
|---|
| Total |
1627
| 100.0
| 100.0
|
|
|---|
| 21-25 |
Valid |
Not Say |
294
| 15.4
| 15.4
| 15.4
|
|---|
| Under $10 |
215
| 11.3
| 11.3
| 26.6
|
|---|
| $10-19 |
261
| 13.7
| 13.7
| 40.3
|
|---|
| $20-29 |
285
| 14.9
| 14.9
| 55.2
|
|---|
| $30-39 |
245
| 12.8
| 12.8
| 68.0
|
|---|
| $40-49 |
208
| 10.9
| 10.9
| 78.9
|
|---|
| $50-74 |
225
| 11.8
| 11.8
| 90.7
|
|---|
| $75-99 |
85
| 4.4
| 4.4
| 95.1
|
|---|
| Over $100 |
93
| 4.9
| 4.9
| 100.0
|
|---|
| Total |
1911
| 100.0
| 100.0
|
|
|---|
| 26-50 |
Valid |
Not Say |
878
| 12.4
| 12.4
| 12.4
|
|---|
| Under $10 |
170
| 2.4
| 2.4
| 14.8
|
|---|
| $10-19 |
344
| 4.8
| 4.8
| 19.6
|
|---|
| $20-29 |
660
| 9.3
| 9.3
| 28.9
|
|---|
| $30-39 |
916
| 12.9
| 12.9
| 41.8
|
|---|
| $40-49 |
849
| 12.0
| 12.0
| 53.8
|
|---|
| $50-74 |
1732
| 24.4
| 24.4
| 78.2
|
|---|
| $75-99 |
795
| 11.2
| 11.2
| 89.4
|
|---|
| Over $100 |
749
| 10.6
| 10.6
| 100.0
|
|---|
| Total |
7093
| 100.0
| 100.0
|
|
|---|
| 50+ |
Valid |
Not Say |
401
| 20.6
| 20.6
| 20.6
|
|---|
| Under $10 |
30
| 1.5
| 1.5
| 22.1
|
|---|
| $10-19 |
87
| 4.5
| 4.5
| 26.6
|
|---|
| $20-29 |
143
| 7.3
| 7.3
| 34.0
|
|---|
| $30-39 |
174
| 8.9
| 8.9
| 42.9
|
|---|
| $40-49 |
190
| 9.8
| 9.8
| 52.7
|
|---|
| $50-74 |
441
| 22.7
| 22.7
| 75.3
|
|---|
| $75-99 |
220
| 11.3
| 11.3
| 86.6
|
|---|
| Over $100 |
260
| 13.4
| 13.4
| 100.0
|
|---|
| Total |
1946
| 100.0
| 100.0
|
|
|---|
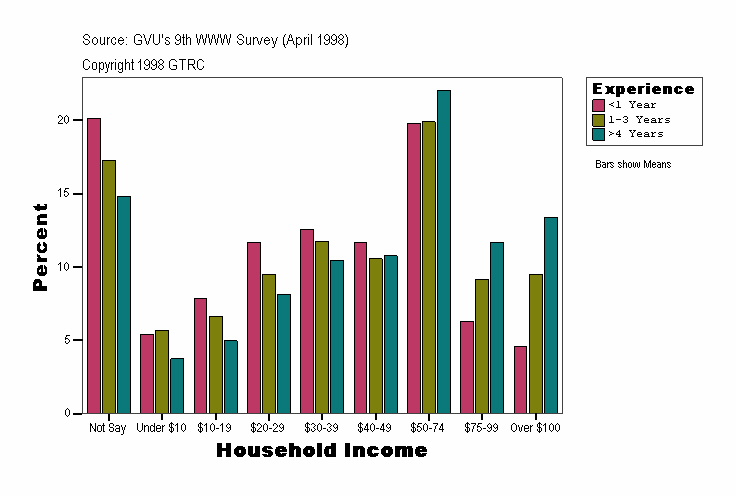
Household Income
| Experience |
Frequency |
Percent |
Valid Percent |
Cumulative Percent |
|---|
| <1 Year |
Valid |
Not Say |
467
| 20.1
| 20.1
| 20.1
|
|---|
| Under $10 |
125
| 5.4
| 5.4
| 25.5
|
|---|
| $10-19 |
182
| 7.8
| 7.8
| 33.4
|
|---|
| $20-29 |
271
| 11.7
| 11.7
| 45.1
|
|---|
| $30-39 |
292
| 12.6
| 12.6
| 57.7
|
|---|
| $40-49 |
270
| 11.6
| 11.6
| 69.3
|
|---|
| $50-74 |
459
| 19.8
| 19.8
| 89.1
|
|---|
| $75-99 |
146
| 6.3
| 6.3
| 95.4
|
|---|
| Over $100 |
107
| 4.6
| 4.6
| 100.0
|
|---|
| Total |
2319
| 100.0
| 100.0
|
|
|---|
| 1-3 Years |
Valid |
Not Say |
976
| 17.2
| 17.2
| 17.2
|
|---|
| Under $10 |
322
| 5.7
| 5.7
| 22.9
|
|---|
| $10-19 |
376
| 6.6
| 6.6
| 29.6
|
|---|
| $20-29 |
539
| 9.5
| 9.5
| 39.1
|
|---|
| $30-39 |
666
| 11.8
| 11.8
| 50.9
|
|---|
| $40-49 |
599
| 10.6
| 10.6
| 61.4
|
|---|
| $50-74 |
1126
| 19.9
| 19.9
| 81.3
|
|---|
| $75-99 |
518
| 9.2
| 9.2
| 90.5
|
|---|
| Over $100 |
539
| 9.5
| 9.5
| 100.0
|
|---|
| Total |
5661
| 100.0
| 100.0
|
|
|---|
| >4 Years |
Valid |
Not Say |
683
| 14.8
| 14.8
| 14.8
|
|---|
| Under $10 |
173
| 3.8
| 3.8
| 18.6
|
|---|
| $10-19 |
230
| 5.0
| 5.0
| 23.6
|
|---|
| $20-29 |
374
| 8.1
| 8.1
| 31.7
|
|---|
| $30-39 |
482
| 10.5
| 10.5
| 42.1
|
|---|
| $40-49 |
497
| 10.8
| 10.8
| 52.9
|
|---|
| $50-74 |
1015
| 22.0
| 22.0
| 74.9
|
|---|
| $75-99 |
539
| 11.7
| 11.7
| 86.6
|
|---|
| Over $100 |
618
| 13.4
| 13.4
| 100.0
|
|---|
| Total |
4611
| 100.0
| 100.0
|
|
|---|
Source: GVU's Ninth WWW User Survey (Conducted April 1998)
URL:http://www.gvu.gatech.edu/user_surveys/
Copyright 1998 GTRC - ALL RIGHTS RESERVED
Contact: www-survey@cc.gatech.edu
For more information or to submit comments:
send email to www-survey@cc.gatech.edu.
GVU's WWW Surveying Team
Graphics, Visualization, & Usability Center
College of Computing
Georgia Institute of Technology
Atlanta, GA 30332-0280
