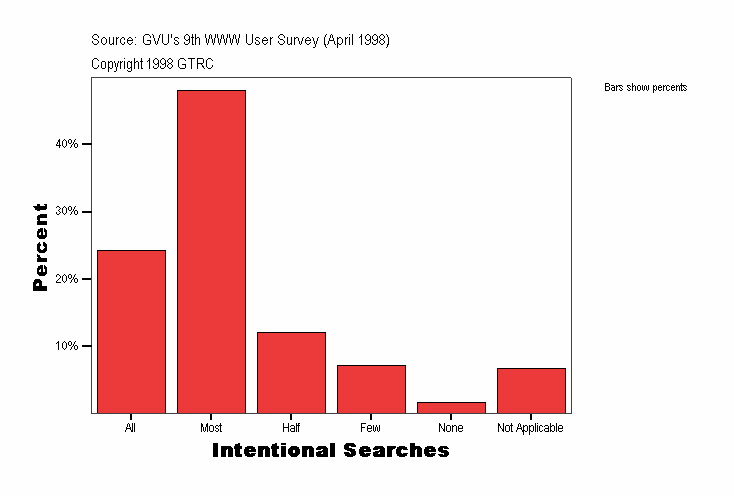
Intentional Searches
|
Frequency |
Percent |
Valid Percent |
Cumulative Percent |
|---|
| Valid |
All |
222
| 24.3
| 24.3
| 24.3
|
|---|
| Most |
439
| 48.0
| 48.0
| 72.2
|
|---|
| Half |
111
| 12.1
| 12.1
| 84.4
|
|---|
| Few |
66
| 7.2
| 7.2
| 91.6
|
|---|
| None |
15
| 1.6
| 1.6
| 93.2
|
|---|
| Not Applicable |
62
| 6.8
| 6.8
| 100.0
|
|---|
| Total |
915
| 100.0
| 100.0
|
|
|---|
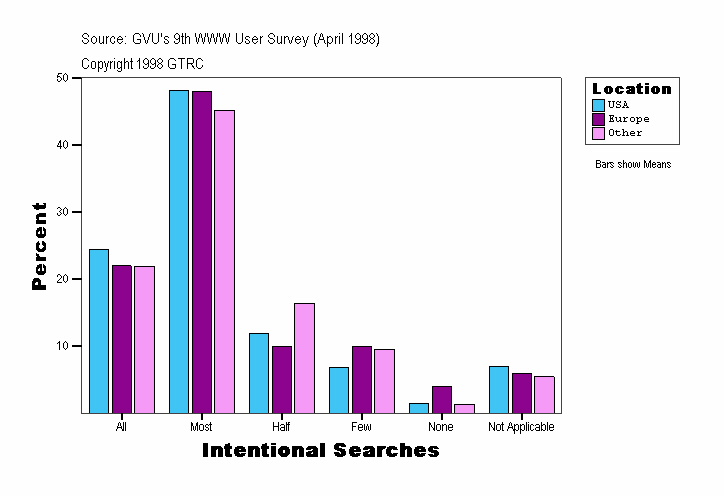
Intentional Searches
| Location |
Frequency |
Percent |
Valid Percent |
Cumulative Percent |
|---|
| . |
Valid |
All |
2
| 50.0
| 50.0
| 50.0
|
|---|
| Most |
2
| 50.0
| 50.0
| 100.0
|
|---|
| Total |
4
| 100.0
| 100.0
|
|
|---|
| USA |
Valid |
All |
193
| 24.5
| 24.5
| 24.5
|
|---|
| Most |
380
| 48.2
| 48.2
| 72.7
|
|---|
| Half |
94
| 11.9
| 11.9
| 84.6
|
|---|
| Few |
54
| 6.9
| 6.9
| 91.5
|
|---|
| None |
12
| 1.5
| 1.5
| 93.0
|
|---|
| Not Applicable |
55
| 7.0
| 7.0
| 100.0
|
|---|
| Total |
788
| 100.0
| 100.0
|
|
|---|
| Europe |
Valid |
All |
11
| 22.0
| 22.0
| 22.0
|
|---|
| Most |
24
| 48.0
| 48.0
| 70.0
|
|---|
| Half |
5
| 10.0
| 10.0
| 80.0
|
|---|
| Few |
5
| 10.0
| 10.0
| 90.0
|
|---|
| None |
2
| 4.0
| 4.0
| 94.0
|
|---|
| Not Applicable |
3
| 6.0
| 6.0
| 100.0
|
|---|
| Total |
50
| 100.0
| 100.0
|
|
|---|
| Other |
Valid |
All |
16
| 21.9
| 21.9
| 21.9
|
|---|
| Most |
33
| 45.2
| 45.2
| 67.1
|
|---|
| Half |
12
| 16.4
| 16.4
| 83.6
|
|---|
| Few |
7
| 9.6
| 9.6
| 93.2
|
|---|
| None |
1
| 1.4
| 1.4
| 94.5
|
|---|
| Not Applicable |
4
| 5.5
| 5.5
| 100.0
|
|---|
| Total |
73
| 100.0
| 100.0
|
|
|---|
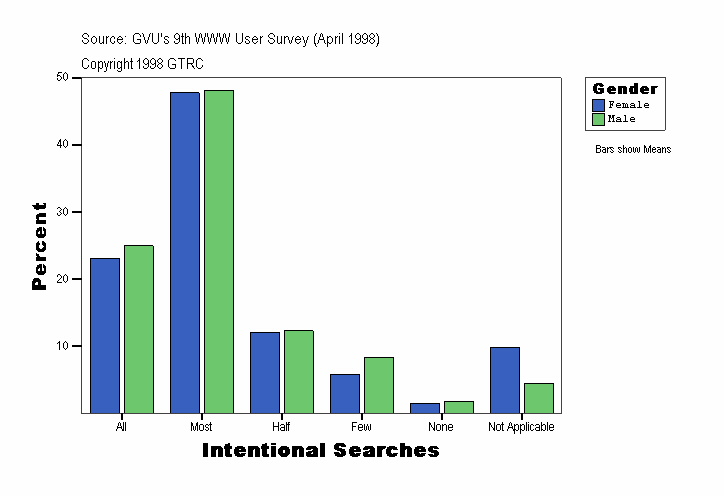
Intentional Searches
| Gender |
Frequency |
Percent |
Valid Percent |
Cumulative Percent |
|---|
| . |
Valid |
All |
2
| 50.0
| 50.0
| 50.0
|
|---|
| Most |
2
| 50.0
| 50.0
| 100.0
|
|---|
| Total |
4
| 100.0
| 100.0
|
|
|---|
| Female |
Valid |
All |
92
| 23.1
| 23.1
| 23.1
|
|---|
| Most |
190
| 47.7
| 47.7
| 70.9
|
|---|
| Half |
48
| 12.1
| 12.1
| 82.9
|
|---|
| Few |
23
| 5.8
| 5.8
| 88.7
|
|---|
| None |
6
| 1.5
| 1.5
| 90.2
|
|---|
| Not Applicable |
39
| 9.8
| 9.8
| 100.0
|
|---|
| Total |
398
| 100.0
| 100.0
|
|
|---|
| Male |
Valid |
All |
128
| 25.0
| 25.0
| 25.0
|
|---|
| Most |
247
| 48.1
| 48.1
| 73.1
|
|---|
| Half |
63
| 12.3
| 12.3
| 85.4
|
|---|
| Few |
43
| 8.4
| 8.4
| 93.8
|
|---|
| None |
9
| 1.8
| 1.8
| 95.5
|
|---|
| Not Applicable |
23
| 4.5
| 4.5
| 100.0
|
|---|
| Total |
513
| 100.0
| 100.0
|
|
|---|
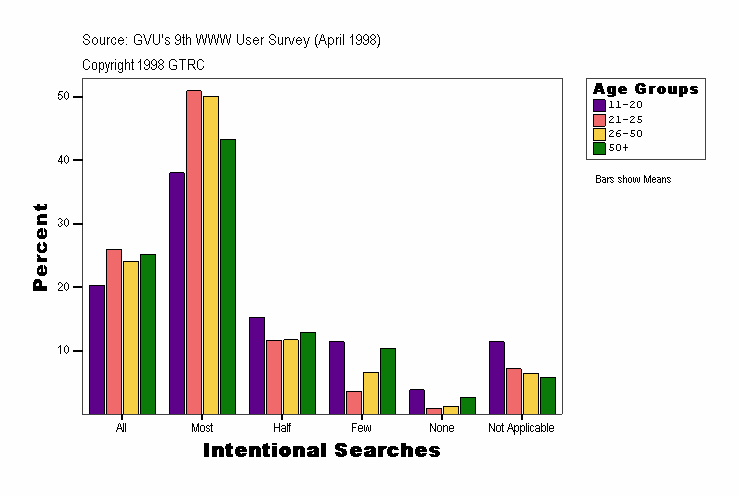
Intentional Searches
| Age Groups |
Frequency |
Percent |
Valid Percent |
Cumulative Percent |
|---|
| . |
Valid |
All |
2
| 50.0
| 50.0
| 50.0
|
|---|
| Most |
2
| 50.0
| 50.0
| 100.0
|
|---|
| Total |
4
| 100.0
| 100.0
|
|
|---|
| 11-20 |
Valid |
All |
16
| 20.3
| 20.3
| 20.3
|
|---|
| Most |
30
| 38.0
| 38.0
| 58.2
|
|---|
| Half |
12
| 15.2
| 15.2
| 73.4
|
|---|
| Few |
9
| 11.4
| 11.4
| 84.8
|
|---|
| None |
3
| 3.8
| 3.8
| 88.6
|
|---|
| Not Applicable |
9
| 11.4
| 11.4
| 100.0
|
|---|
| Total |
79
| 100.0
| 100.0
|
|
|---|
| 21-25 |
Valid |
All |
29
| 25.9
| 25.9
| 25.9
|
|---|
| Most |
57
| 50.9
| 50.9
| 76.8
|
|---|
| Half |
13
| 11.6
| 11.6
| 88.4
|
|---|
| Few |
4
| 3.6
| 3.6
| 92.0
|
|---|
| None |
1
| .9
| .9
| 92.9
|
|---|
| Not Applicable |
8
| 7.1
| 7.1
| 100.0
|
|---|
| Total |
112
| 100.0
| 100.0
|
|
|---|
| 26-50 |
Valid |
All |
136
| 24.1
| 24.1
| 24.1
|
|---|
| Most |
283
| 50.1
| 50.1
| 74.2
|
|---|
| Half |
66
| 11.7
| 11.7
| 85.8
|
|---|
| Few |
37
| 6.5
| 6.5
| 92.4
|
|---|
| None |
7
| 1.2
| 1.2
| 93.6
|
|---|
| Not Applicable |
36
| 6.4
| 6.4
| 100.0
|
|---|
| Total |
565
| 100.0
| 100.0
|
|
|---|
| 50+ |
Valid |
All |
39
| 25.2
| 25.2
| 25.2
|
|---|
| Most |
67
| 43.2
| 43.2
| 68.4
|
|---|
| Half |
20
| 12.9
| 12.9
| 81.3
|
|---|
| Few |
16
| 10.3
| 10.3
| 91.6
|
|---|
| None |
4
| 2.6
| 2.6
| 94.2
|
|---|
| Not Applicable |
9
| 5.8
| 5.8
| 100.0
|
|---|
| Total |
155
| 100.0
| 100.0
|
|
|---|
Intentional Searches
| Experience |
Frequency |
Percent |
Valid Percent |
Cumulative Percent |
|---|
| . |
Valid |
All |
2
| 50.0
| 50.0
| 50.0
|
|---|
| Most |
2
| 50.0
| 50.0
| 100.0
|
|---|
| Total |
4
| 100.0
| 100.0
|
|
|---|
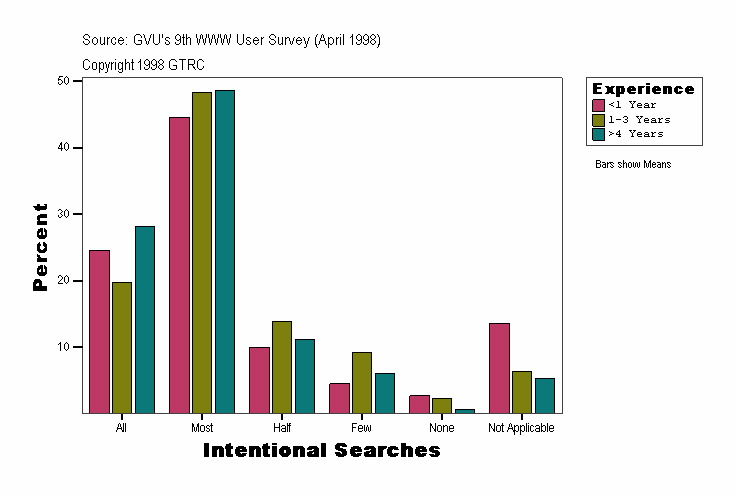
| <1 Year |
Valid |
All |
27
| 24.5
| 24.5
| 24.5
|
|---|
| Most |
49
| 44.5
| 44.5
| 69.1
|
|---|
| Half |
11
| 10.0
| 10.0
| 79.1
|
|---|
| Few |
5
| 4.5
| 4.5
| 83.6
|
|---|
| None |
3
| 2.7
| 2.7
| 86.4
|
|---|
| Not Applicable |
15
| 13.6
| 13.6
| 100.0
|
|---|
| Total |
110
| 100.0
| 100.0
|
|
|---|
| 1-3 Years |
Valid |
All |
77
| 19.8
| 19.8
| 19.8
|
|---|
| Most |
188
| 48.3
| 48.3
| 68.1
|
|---|
| Half |
54
| 13.9
| 13.9
| 82.0
|
|---|
| Few |
36
| 9.3
| 9.3
| 91.3
|
|---|
| None |
9
| 2.3
| 2.3
| 93.6
|
|---|
| Not Applicable |
25
| 6.4
| 6.4
| 100.0
|
|---|
| Total |
389
| 100.0
| 100.0
|
|
|---|
| >4 Years |
Valid |
All |
116
| 28.2
| 28.2
| 28.2
|
|---|
| Most |
200
| 48.5
| 48.5
| 76.7
|
|---|
| Half |
46
| 11.2
| 11.2
| 87.9
|
|---|
| Few |
25
| 6.1
| 6.1
| 93.9
|
|---|
| None |
3
| .7
| .7
| 94.7
|
|---|
| Not Applicable |
22
| 5.3
| 5.3
| 100.0
|
|---|
| Total |
412
| 100.0
| 100.0
|
|
|---|
Source: GVU's Ninth WWW User Survey (Conducted April 1998)
URL:http://www.gvu.gatech.edu/user_surveys/
Copyright 1998 GTRC - ALL RIGHTS RESERVED
Contact: www-survey@cc.gatech.edu
For more information or to submit comments:
send email to www-survey@cc.gatech.edu.
GVU's WWW Surveying Team
Graphics, Visualization, & Usability Center
College of Computing
Georgia Institute of Technology
Atlanta, GA 30332-0280
