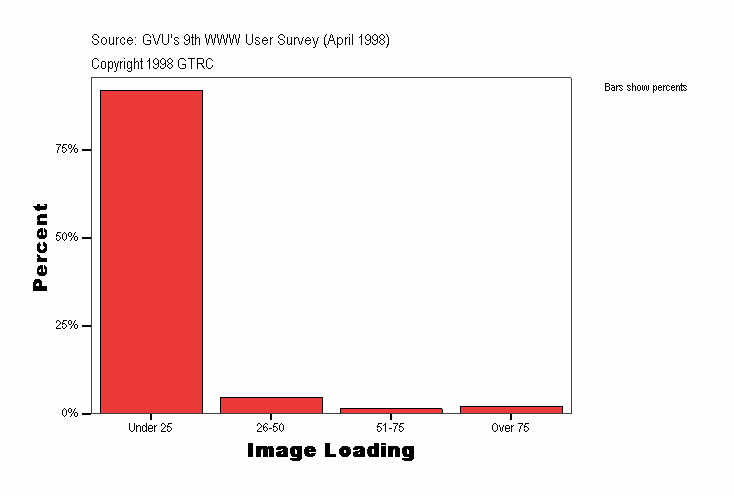
Image Loading
|
Frequency |
Percent |
Valid Percent |
Cumulative Percent |
|---|
| Valid |
Under 25 |
8399
| 91.8
| 91.8
| 91.8
|
|---|
| 26-50 |
426
| 4.7
| 4.7
| 96.4
|
|---|
| 51-75 |
129
| 1.4
| 1.4
| 97.9
|
|---|
| Over 75 |
196
| 2.1
| 2.1
| 100.0
|
|---|
| Total |
9150
| 100.0
| 100.0
|
|
|---|
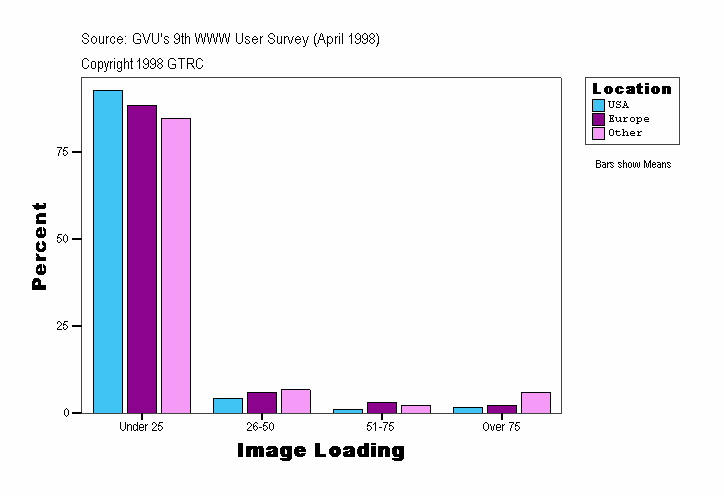
Image Loading
| Location |
Frequency |
Percent |
Valid Percent |
Cumulative Percent |
|---|
| . |
Valid |
Under 25 |
116
| 90.6
| 90.6
| 90.6
|
|---|
| 26-50 |
8
| 6.3
| 6.3
| 96.9
|
|---|
| 51-75 |
1
| .8
| .8
| 97.7
|
|---|
| Over 75 |
3
| 2.3
| 2.3
| 100.0
|
|---|
| Total |
128
| 100.0
| 100.0
|
|
|---|
| USA |
Valid |
Under 25 |
7073
| 92.8
| 92.8
| 92.8
|
|---|
| 26-50 |
327
| 4.3
| 4.3
| 97.1
|
|---|
| 51-75 |
91
| 1.2
| 1.2
| 98.3
|
|---|
| Over 75 |
128
| 1.7
| 1.7
| 100.0
|
|---|
| Total |
7619
| 100.0
| 100.0
|
|
|---|
| Europe |
Valid |
Under 25 |
473
| 88.6
| 88.6
| 88.6
|
|---|
| 26-50 |
32
| 6.0
| 6.0
| 94.6
|
|---|
| 51-75 |
17
| 3.2
| 3.2
| 97.8
|
|---|
| Over 75 |
12
| 2.2
| 2.2
| 100.0
|
|---|
| Total |
534
| 100.0
| 100.0
|
|
|---|
| Other |
Valid |
Under 25 |
737
| 84.8
| 84.8
| 84.8
|
|---|
| 26-50 |
59
| 6.8
| 6.8
| 91.6
|
|---|
| 51-75 |
20
| 2.3
| 2.3
| 93.9
|
|---|
| Over 75 |
53
| 6.1
| 6.1
| 100.0
|
|---|
| Total |
869
| 100.0
| 100.0
|
|
|---|
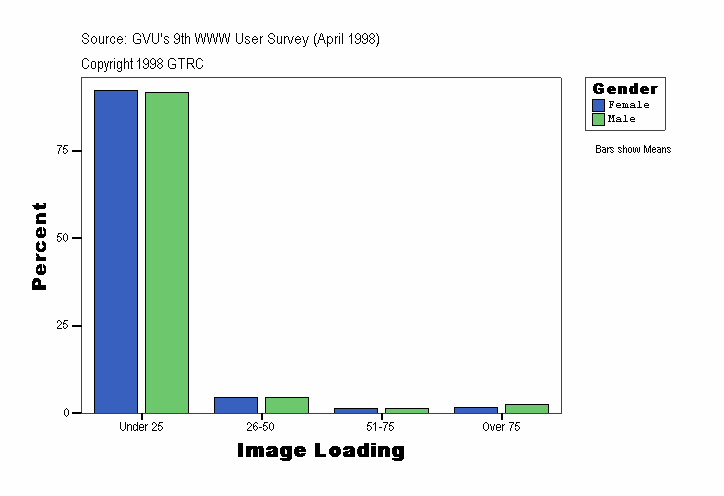
Image Loading
| Gender |
Frequency |
Percent |
Valid Percent |
Cumulative Percent |
|---|
| . |
Valid |
Under 25 |
116
| 90.6
| 90.6
| 90.6
|
|---|
| 26-50 |
8
| 6.3
| 6.3
| 96.9
|
|---|
| 51-75 |
1
| .8
| .8
| 97.7
|
|---|
| Over 75 |
3
| 2.3
| 2.3
| 100.0
|
|---|
| Total |
128
| 100.0
| 100.0
|
|
|---|
| Female |
Valid |
Under 25 |
3194
| 92.3
| 92.3
| 92.3
|
|---|
| 26-50 |
161
| 4.7
| 4.7
| 96.9
|
|---|
| 51-75 |
50
| 1.4
| 1.4
| 98.4
|
|---|
| Over 75 |
57
| 1.6
| 1.6
| 100.0
|
|---|
| Total |
3462
| 100.0
| 100.0
|
|
|---|
| Male |
Valid |
Under 25 |
5089
| 91.5
| 91.5
| 91.5
|
|---|
| 26-50 |
257
| 4.6
| 4.6
| 96.2
|
|---|
| 51-75 |
78
| 1.4
| 1.4
| 97.6
|
|---|
| Over 75 |
136
| 2.4
| 2.4
| 100.0
|
|---|
| Total |
5560
| 100.0
| 100.0
|
|
|---|
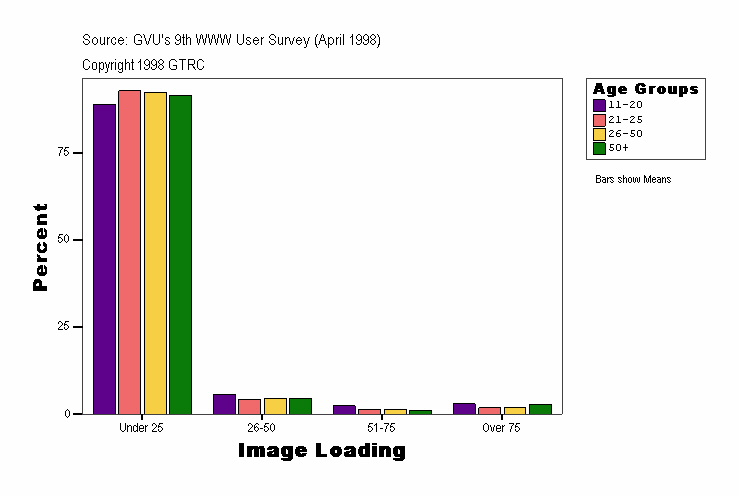
Image Loading
| Age Groups |
Frequency |
Percent |
Valid Percent |
Cumulative Percent |
|---|
| . |
Valid |
Under 25 |
120
| 89.6
| 89.6
| 89.6
|
|---|
| 26-50 |
9
| 6.7
| 6.7
| 96.3
|
|---|
| 51-75 |
1
| .7
| .7
| 97.0
|
|---|
| Over 75 |
4
| 3.0
| 3.0
| 100.0
|
|---|
| Total |
134
| 100.0
| 100.0
|
|
|---|
| 11-20 |
Valid |
Under 25 |
916
| 88.8
| 88.8
| 88.8
|
|---|
| 26-50 |
59
| 5.7
| 5.7
| 94.6
|
|---|
| 51-75 |
25
| 2.4
| 2.4
| 97.0
|
|---|
| Over 75 |
31
| 3.0
| 3.0
| 100.0
|
|---|
| Total |
1031
| 100.0
| 100.0
|
|
|---|
| 21-25 |
Valid |
Under 25 |
1221
| 92.7
| 92.7
| 92.7
|
|---|
| 26-50 |
56
| 4.3
| 4.3
| 97.0
|
|---|
| 51-75 |
17
| 1.3
| 1.3
| 98.3
|
|---|
| Over 75 |
23
| 1.7
| 1.7
| 100.0
|
|---|
| Total |
1317
| 100.0
| 100.0
|
|
|---|
| 26-50 |
Valid |
Under 25 |
4835
| 92.3
| 92.3
| 92.3
|
|---|
| 26-50 |
237
| 4.5
| 4.5
| 96.8
|
|---|
| 51-75 |
70
| 1.3
| 1.3
| 98.1
|
|---|
| Over 75 |
98
| 1.9
| 1.9
| 100.0
|
|---|
| Total |
5240
| 100.0
| 100.0
|
|
|---|
| 50+ |
Valid |
Under 25 |
1307
| 91.5
| 91.5
| 91.5
|
|---|
| 26-50 |
65
| 4.6
| 4.6
| 96.1
|
|---|
| 51-75 |
16
| 1.1
| 1.1
| 97.2
|
|---|
| Over 75 |
40
| 2.8
| 2.8
| 100.0
|
|---|
| Total |
1428
| 100.0
| 100.0
|
|
|---|
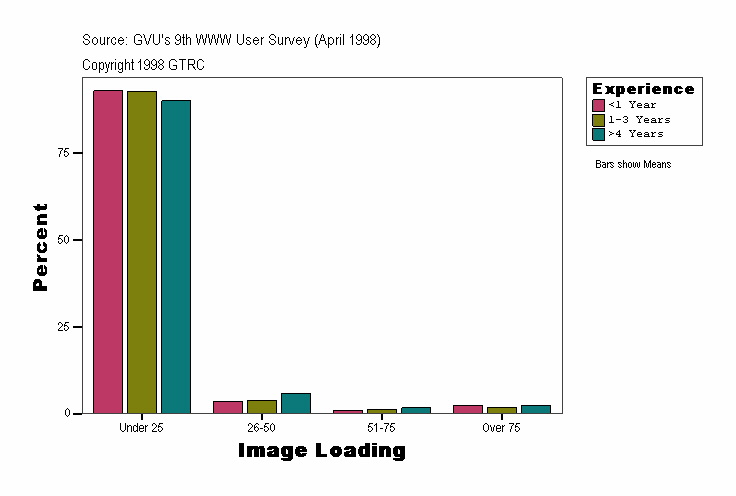
Image Loading
| Experience |
Frequency |
Percent |
Valid Percent |
Cumulative Percent |
|---|
| . |
Valid |
Under 25 |
116
| 90.6
| 90.6
| 90.6
|
|---|
| 26-50 |
8
| 6.3
| 6.3
| 96.9
|
|---|
| 51-75 |
1
| .8
| .8
| 97.7
|
|---|
| Over 75 |
3
| 2.3
| 2.3
| 100.0
|
|---|
| Total |
128
| 100.0
| 100.0
|
|
|---|
| <1 Year |
Valid |
Under 25 |
1407
| 93.0
| 93.0
| 93.0
|
|---|
| 26-50 |
56
| 3.7
| 3.7
| 96.7
|
|---|
| 51-75 |
14
| .9
| .9
| 97.6
|
|---|
| Over 75 |
36
| 2.4
| 2.4
| 100.0
|
|---|
| Total |
1513
| 100.0
| 100.0
|
|
|---|
| 1-3 Years |
Valid |
Under 25 |
3719
| 92.9
| 92.9
| 92.9
|
|---|
| 26-50 |
158
| 3.9
| 3.9
| 96.8
|
|---|
| 51-75 |
54
| 1.3
| 1.3
| 98.2
|
|---|
| Over 75 |
73
| 1.8
| 1.8
| 100.0
|
|---|
| Total |
4004
| 100.0
| 100.0
|
|
|---|
| >4 Years |
Valid |
Under 25 |
3157
| 90.1
| 90.1
| 90.1
|
|---|
| 26-50 |
204
| 5.8
| 5.8
| 95.9
|
|---|
| 51-75 |
60
| 1.7
| 1.7
| 97.6
|
|---|
| Over 75 |
84
| 2.4
| 2.4
| 100.0
|
|---|
| Total |
3505
| 100.0
| 100.0
|
|
|---|
Source: GVU's Ninth WWW User Survey (Conducted April 1998)
URL:http://www.gvu.gatech.edu/user_surveys/
Copyright 1998 GTRC - ALL RIGHTS RESERVED
Contact: www-survey@cc.gatech.edu
For more information or to submit comments:
send email to www-survey@cc.gatech.edu.
GVU's WWW Surveying Team
Graphics, Visualization, & Usability Center
College of Computing
Georgia Institute of Technology
Atlanta, GA 30332-0280
