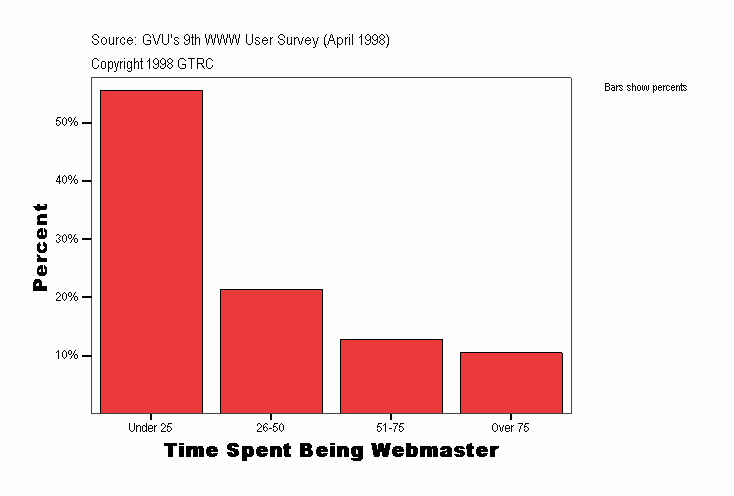
Time Spent Being Webmaster
|
Frequency |
Percent |
Valid Percent |
Cumulative Percent |
|---|
| Valid |
Under 25 |
435
| 55.5
| 55.5
| 55.5
|
|---|
| 26-50 |
167
| 21.3
| 21.3
| 76.8
|
|---|
| 51-75 |
100
| 12.8
| 12.8
| 89.5
|
|---|
| Over 75 |
82
| 10.5
| 10.5
| 100.0
|
|---|
| Total |
784
| 100.0
| 100.0
|
|
|---|
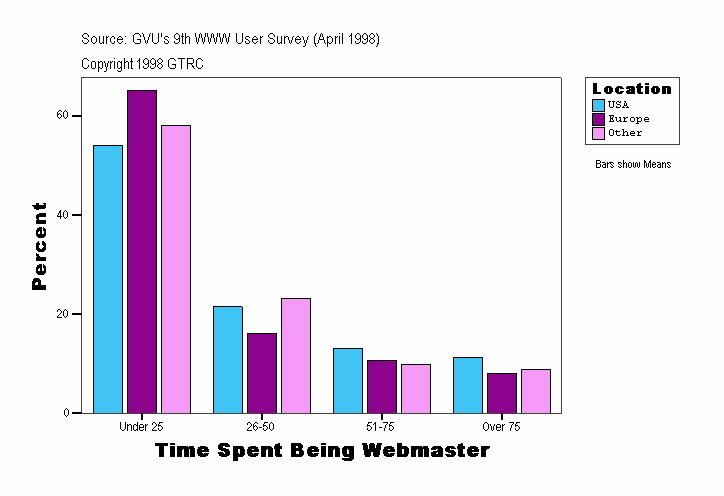
Time Spent Being Webmaster
| Location |
Frequency |
Percent |
Valid Percent |
Cumulative Percent |
|---|
| . |
Valid |
Under 25 |
5
| 25.0
| 25.0
| 25.0
|
|---|
| 26-50 |
7
| 35.0
| 35.0
| 60.0
|
|---|
| 51-75 |
6
| 30.0
| 30.0
| 90.0
|
|---|
| Over 75 |
2
| 10.0
| 10.0
| 100.0
|
|---|
| Total |
20
| 100.0
| 100.0
|
|
|---|
| USA |
Valid |
Under 25 |
292
| 54.1
| 54.1
| 54.1
|
|---|
| 26-50 |
116
| 21.5
| 21.5
| 75.6
|
|---|
| 51-75 |
71
| 13.1
| 13.1
| 88.7
|
|---|
| Over 75 |
61
| 11.3
| 11.3
| 100.0
|
|---|
| Total |
540
| 100.0
| 100.0
|
|
|---|
| Europe |
Valid |
Under 25 |
73
| 65.2
| 65.2
| 65.2
|
|---|
| 26-50 |
18
| 16.1
| 16.1
| 81.3
|
|---|
| 51-75 |
12
| 10.7
| 10.7
| 92.0
|
|---|
| Over 75 |
9
| 8.0
| 8.0
| 100.0
|
|---|
| Total |
112
| 100.0
| 100.0
|
|
|---|
| Other |
Valid |
Under 25 |
65
| 58.0
| 58.0
| 58.0
|
|---|
| 26-50 |
26
| 23.2
| 23.2
| 81.3
|
|---|
| 51-75 |
11
| 9.8
| 9.8
| 91.1
|
|---|
| Over 75 |
10
| 8.9
| 8.9
| 100.0
|
|---|
| Total |
112
| 100.0
| 100.0
|
|
|---|
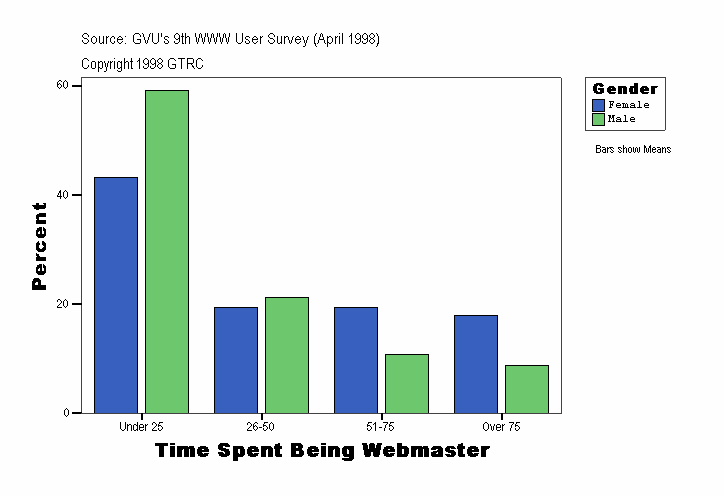
Time Spent Being Webmaster
| Gender |
Frequency |
Percent |
Valid Percent |
Cumulative Percent |
|---|
| . |
Valid |
Under 25 |
5
| 25.0
| 25.0
| 25.0
|
|---|
| 26-50 |
7
| 35.0
| 35.0
| 60.0
|
|---|
| 51-75 |
6
| 30.0
| 30.0
| 90.0
|
|---|
| Over 75 |
2
| 10.0
| 10.0
| 100.0
|
|---|
| Total |
20
| 100.0
| 100.0
|
|
|---|
| Female |
Valid |
Under 25 |
60
| 43.2
| 43.2
| 43.2
|
|---|
| 26-50 |
27
| 19.4
| 19.4
| 62.6
|
|---|
| 51-75 |
27
| 19.4
| 19.4
| 82.0
|
|---|
| Over 75 |
25
| 18.0
| 18.0
| 100.0
|
|---|
| Total |
139
| 100.0
| 100.0
|
|
|---|
| Male |
Valid |
Under 25 |
370
| 59.2
| 59.2
| 59.2
|
|---|
| 26-50 |
133
| 21.3
| 21.3
| 80.5
|
|---|
| 51-75 |
67
| 10.7
| 10.7
| 91.2
|
|---|
| Over 75 |
55
| 8.8
| 8.8
| 100.0
|
|---|
| Total |
625
| 100.0
| 100.0
|
|
|---|
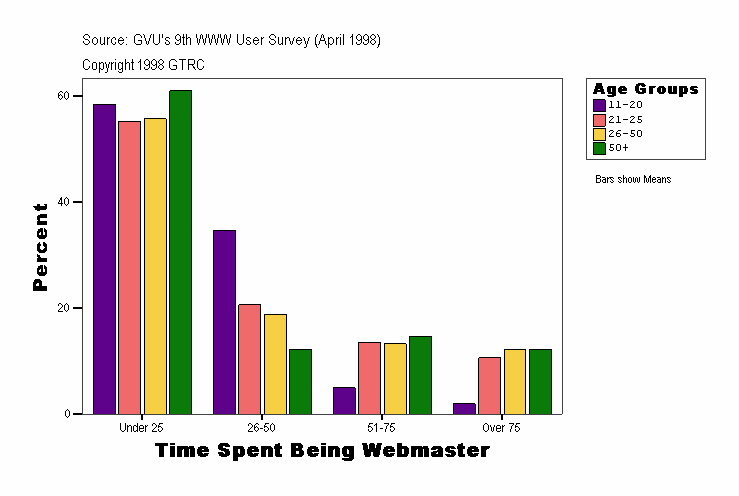
Time Spent Being Webmaster
| Age Groups |
Frequency |
Percent |
Valid Percent |
Cumulative Percent |
|---|
| . |
Valid |
Under 25 |
5
| 25.0
| 25.0
| 25.0
|
|---|
| 26-50 |
7
| 35.0
| 35.0
| 60.0
|
|---|
| 51-75 |
6
| 30.0
| 30.0
| 90.0
|
|---|
| Over 75 |
2
| 10.0
| 10.0
| 100.0
|
|---|
| Total |
20
| 100.0
| 100.0
|
|
|---|
| 11-20 |
Valid |
Under 25 |
59
| 58.4
| 58.4
| 58.4
|
|---|
| 26-50 |
35
| 34.7
| 34.7
| 93.1
|
|---|
| 51-75 |
5
| 5.0
| 5.0
| 98.0
|
|---|
| Over 75 |
2
| 2.0
| 2.0
| 100.0
|
|---|
| Total |
101
| 100.0
| 100.0
|
|
|---|
| 21-25 |
Valid |
Under 25 |
94
| 55.3
| 55.3
| 55.3
|
|---|
| 26-50 |
35
| 20.6
| 20.6
| 75.9
|
|---|
| 51-75 |
23
| 13.5
| 13.5
| 89.4
|
|---|
| Over 75 |
18
| 10.6
| 10.6
| 100.0
|
|---|
| Total |
170
| 100.0
| 100.0
|
|
|---|
| 26-50 |
Valid |
Under 25 |
252
| 55.8
| 55.8
| 55.8
|
|---|
| 26-50 |
85
| 18.8
| 18.8
| 74.6
|
|---|
| 51-75 |
60
| 13.3
| 13.3
| 87.8
|
|---|
| Over 75 |
55
| 12.2
| 12.2
| 100.0
|
|---|
| Total |
452
| 100.0
| 100.0
|
|
|---|
| 50+ |
Valid |
Under 25 |
25
| 61.0
| 61.0
| 61.0
|
|---|
| 26-50 |
5
| 12.2
| 12.2
| 73.2
|
|---|
| 51-75 |
6
| 14.6
| 14.6
| 87.8
|
|---|
| Over 75 |
5
| 12.2
| 12.2
| 100.0
|
|---|
| Total |
41
| 100.0
| 100.0
|
|
|---|
Time Spent Being Webmaster
| Experience |
Frequency |
Percent |
Valid Percent |
Cumulative Percent |
|---|
| . |
Valid |
Under 25 |
5
| 25.0
| 25.0
| 25.0
|
|---|
| 26-50 |
7
| 35.0
| 35.0
| 60.0
|
|---|
| 51-75 |
6
| 30.0
| 30.0
| 90.0
|
|---|
| Over 75 |
2
| 10.0
| 10.0
| 100.0
|
|---|
| Total |
20
| 100.0
| 100.0
|
|
|---|
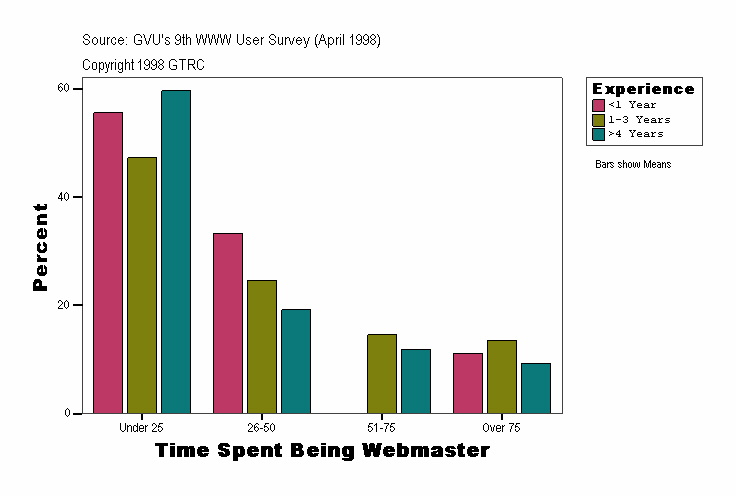
| <1 Year |
Valid |
Under 25 |
10
| 55.6
| 55.6
| 55.6
|
|---|
| 26-50 |
6
| 33.3
| 33.3
| 88.9
|
|---|
| Over 75 |
2
| 11.1
| 11.1
| 100.0
|
|---|
| Total |
18
| 100.0
| 100.0
|
|
|---|
| 1-3 Years |
Valid |
Under 25 |
94
| 47.2
| 47.2
| 47.2
|
|---|
| 26-50 |
49
| 24.6
| 24.6
| 71.9
|
|---|
| 51-75 |
29
| 14.6
| 14.6
| 86.4
|
|---|
| Over 75 |
27
| 13.6
| 13.6
| 100.0
|
|---|
| Total |
199
| 100.0
| 100.0
|
|
|---|
| >4 Years |
Valid |
Under 25 |
326
| 59.6
| 59.6
| 59.6
|
|---|
| 26-50 |
105
| 19.2
| 19.2
| 78.8
|
|---|
| 51-75 |
65
| 11.9
| 11.9
| 90.7
|
|---|
| Over 75 |
51
| 9.3
| 9.3
| 100.0
|
|---|
| Total |
547
| 100.0
| 100.0
|
|
|---|
Source: GVU's Ninth WWW User Survey (Conducted April 1998)
URL:http://www.gvu.gatech.edu/user_surveys/
Copyright 1998 GTRC - ALL RIGHTS RESERVED
Contact: www-survey@cc.gatech.edu
For more information or to submit comments:
send email to www-survey@cc.gatech.edu.
GVU's WWW Surveying Team
Graphics, Visualization, & Usability Center
College of Computing
Georgia Institute of Technology
Atlanta, GA 30332-0280
