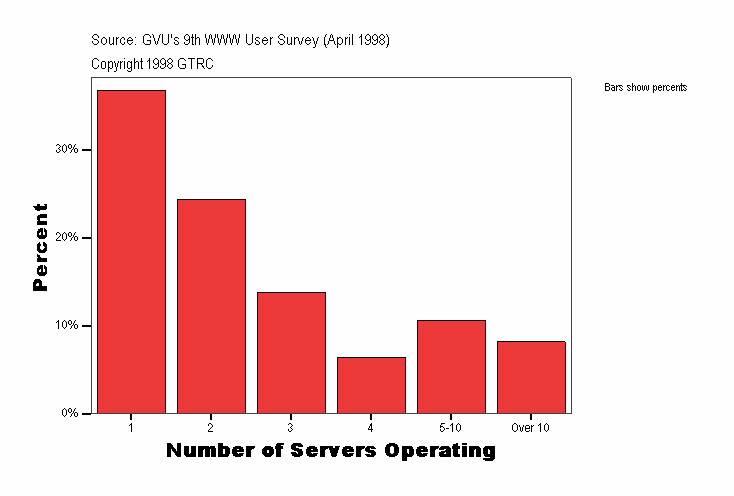
Number of Servers Operating
|
Frequency |
Percent |
Valid Percent |
Cumulative Percent |
|---|
| Valid |
1 |
288
| 36.7
| 36.7
| 36.7
|
|---|
| 2 |
191
| 24.4
| 24.4
| 61.1
|
|---|
| 3 |
108
| 13.8
| 13.8
| 74.9
|
|---|
| 4 |
50
| 6.4
| 6.4
| 81.3
|
|---|
| 5-10 |
83
| 10.6
| 10.6
| 91.8
|
|---|
| Over 10 |
64
| 8.2
| 8.2
| 100.0
|
|---|
| Total |
784
| 100.0
| 100.0
|
|
|---|
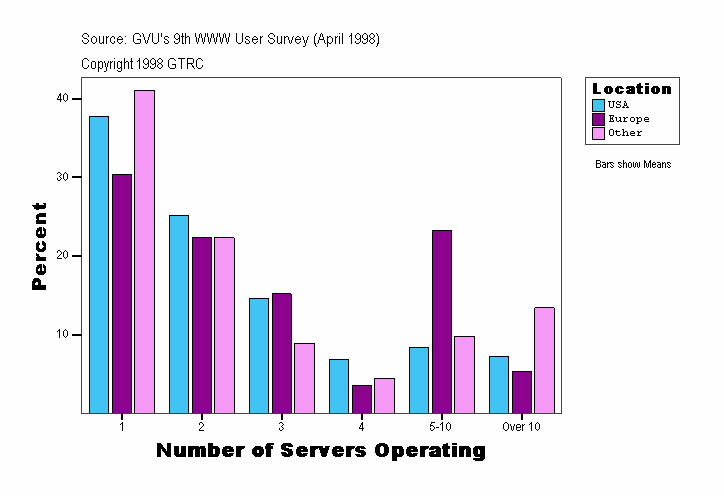
Number of Servers Operating
| Location |
Frequency |
Percent |
Valid Percent |
Cumulative Percent |
|---|
| . |
Valid |
1 |
4
| 20.0
| 20.0
| 20.0
|
|---|
| 2 |
5
| 25.0
| 25.0
| 45.0
|
|---|
| 3 |
2
| 10.0
| 10.0
| 55.0
|
|---|
| 4 |
4
| 20.0
| 20.0
| 75.0
|
|---|
| 5-10 |
1
| 5.0
| 5.0
| 80.0
|
|---|
| Over 10 |
4
| 20.0
| 20.0
| 100.0
|
|---|
| Total |
20
| 100.0
| 100.0
|
|
|---|
| USA |
Valid |
1 |
204
| 37.8
| 37.8
| 37.8
|
|---|
| 2 |
136
| 25.2
| 25.2
| 63.0
|
|---|
| 3 |
79
| 14.6
| 14.6
| 77.6
|
|---|
| 4 |
37
| 6.9
| 6.9
| 84.4
|
|---|
| 5-10 |
45
| 8.3
| 8.3
| 92.8
|
|---|
| Over 10 |
39
| 7.2
| 7.2
| 100.0
|
|---|
| Total |
540
| 100.0
| 100.0
|
|
|---|
| Europe |
Valid |
1 |
34
| 30.4
| 30.4
| 30.4
|
|---|
| 2 |
25
| 22.3
| 22.3
| 52.7
|
|---|
| 3 |
17
| 15.2
| 15.2
| 67.9
|
|---|
| 4 |
4
| 3.6
| 3.6
| 71.4
|
|---|
| 5-10 |
26
| 23.2
| 23.2
| 94.6
|
|---|
| Over 10 |
6
| 5.4
| 5.4
| 100.0
|
|---|
| Total |
112
| 100.0
| 100.0
|
|
|---|
| Other |
Valid |
1 |
46
| 41.1
| 41.1
| 41.1
|
|---|
| 2 |
25
| 22.3
| 22.3
| 63.4
|
|---|
| 3 |
10
| 8.9
| 8.9
| 72.3
|
|---|
| 4 |
5
| 4.5
| 4.5
| 76.8
|
|---|
| 5-10 |
11
| 9.8
| 9.8
| 86.6
|
|---|
| Over 10 |
15
| 13.4
| 13.4
| 100.0
|
|---|
| Total |
112
| 100.0
| 100.0
|
|
|---|
Number of Servers Operating
| Gender |
Frequency |
Percent |
Valid Percent |
Cumulative Percent |
|---|
| . |
Valid |
1 |
4
| 20.0
| 20.0
| 20.0
|
|---|
| 2 |
5
| 25.0
| 25.0
| 45.0
|
|---|
| 3 |
2
| 10.0
| 10.0
| 55.0
|
|---|
| 4 |
4
| 20.0
| 20.0
| 75.0
|
|---|
| 5-10 |
1
| 5.0
| 5.0
| 80.0
|
|---|
| Over 10 |
4
| 20.0
| 20.0
| 100.0
|
|---|
| Total |
20
| 100.0
| 100.0
|
|
|---|
| Female |
Valid |
1 |
80
| 57.6
| 57.6
| 57.6
|
|---|
| 2 |
35
| 25.2
| 25.2
| 82.7
|
|---|
| 3 |
8
| 5.8
| 5.8
| 88.5
|
|---|
| 4 |
6
| 4.3
| 4.3
| 92.8
|
|---|
| 5-10 |
7
| 5.0
| 5.0
| 97.8
|
|---|
| Over 10 |
3
| 2.2
| 2.2
| 100.0
|
|---|
| Total |
139
| 100.0
| 100.0
|
|
|---|
| Male |
Valid |
1 |
204
| 32.6
| 32.6
| 32.6
|
|---|
| 2 |
151
| 24.2
| 24.2
| 56.8
|
|---|
| 3 |
98
| 15.7
| 15.7
| 72.5
|
|---|
| 4 |
40
| 6.4
| 6.4
| 78.9
|
|---|
| 5-10 |
75
| 12.0
| 12.0
| 90.9
|
|---|
| Over 10 |
57
| 9.1
| 9.1
| 100.0
|
|---|
| Total |
625
| 100.0
| 100.0
|
|
|---|
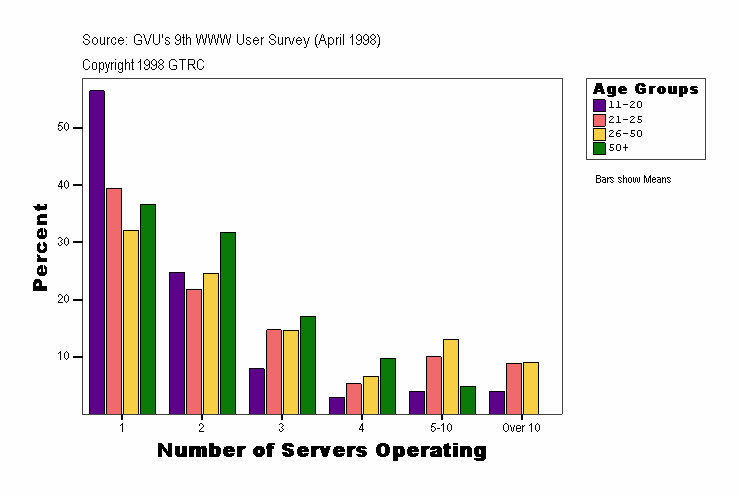
Number of Servers Operating
| Age Groups |
Frequency |
Percent |
Valid Percent |
Cumulative Percent |
|---|
| . |
Valid |
1 |
4
| 20.0
| 20.0
| 20.0
|
|---|
| 2 |
5
| 25.0
| 25.0
| 45.0
|
|---|
| 3 |
2
| 10.0
| 10.0
| 55.0
|
|---|
| 4 |
4
| 20.0
| 20.0
| 75.0
|
|---|
| 5-10 |
1
| 5.0
| 5.0
| 80.0
|
|---|
| Over 10 |
4
| 20.0
| 20.0
| 100.0
|
|---|
| Total |
20
| 100.0
| 100.0
|
|
|---|
| 11-20 |
Valid |
1 |
57
| 56.4
| 56.4
| 56.4
|
|---|
| 2 |
25
| 24.8
| 24.8
| 81.2
|
|---|
| 3 |
8
| 7.9
| 7.9
| 89.1
|
|---|
| 4 |
3
| 3.0
| 3.0
| 92.1
|
|---|
| 5-10 |
4
| 4.0
| 4.0
| 96.0
|
|---|
| Over 10 |
4
| 4.0
| 4.0
| 100.0
|
|---|
| Total |
101
| 100.0
| 100.0
|
|
|---|
| 21-25 |
Valid |
1 |
67
| 39.4
| 39.4
| 39.4
|
|---|
| 2 |
37
| 21.8
| 21.8
| 61.2
|
|---|
| 3 |
25
| 14.7
| 14.7
| 75.9
|
|---|
| 4 |
9
| 5.3
| 5.3
| 81.2
|
|---|
| 5-10 |
17
| 10.0
| 10.0
| 91.2
|
|---|
| Over 10 |
15
| 8.8
| 8.8
| 100.0
|
|---|
| Total |
170
| 100.0
| 100.0
|
|
|---|
| 26-50 |
Valid |
1 |
145
| 32.1
| 32.1
| 32.1
|
|---|
| 2 |
111
| 24.6
| 24.6
| 56.6
|
|---|
| 3 |
66
| 14.6
| 14.6
| 71.2
|
|---|
| 4 |
30
| 6.6
| 6.6
| 77.9
|
|---|
| 5-10 |
59
| 13.1
| 13.1
| 90.9
|
|---|
| Over 10 |
41
| 9.1
| 9.1
| 100.0
|
|---|
| Total |
452
| 100.0
| 100.0
|
|
|---|
| 50+ |
Valid |
1 |
15
| 36.6
| 36.6
| 36.6
|
|---|
| 2 |
13
| 31.7
| 31.7
| 68.3
|
|---|
| 3 |
7
| 17.1
| 17.1
| 85.4
|
|---|
| 4 |
4
| 9.8
| 9.8
| 95.1
|
|---|
| 5-10 |
2
| 4.9
| 4.9
| 100.0
|
|---|
| Total |
41
| 100.0
| 100.0
|
|
|---|
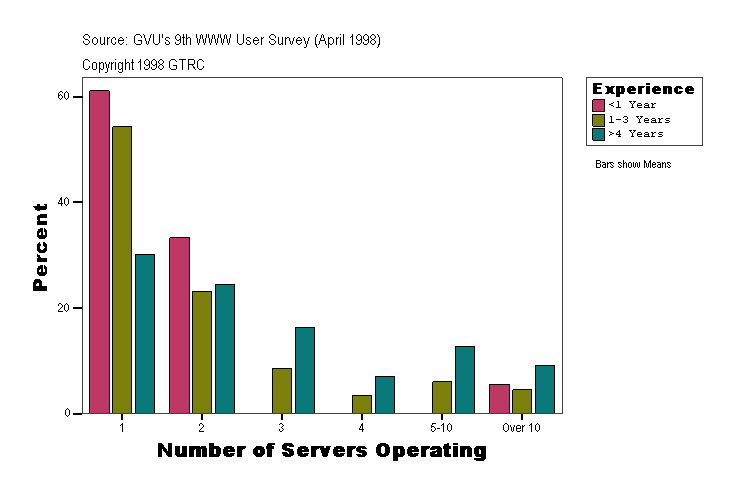
Number of Servers Operating
| Experience |
Frequency |
Percent |
Valid Percent |
Cumulative Percent |
|---|
| . |
Valid |
1 |
4
| 20.0
| 20.0
| 20.0
|
|---|
| 2 |
5
| 25.0
| 25.0
| 45.0
|
|---|
| 3 |
2
| 10.0
| 10.0
| 55.0
|
|---|
| 4 |
4
| 20.0
| 20.0
| 75.0
|
|---|
| 5-10 |
1
| 5.0
| 5.0
| 80.0
|
|---|
| Over 10 |
4
| 20.0
| 20.0
| 100.0
|
|---|
| Total |
20
| 100.0
| 100.0
|
|
|---|
| <1 Year |
Valid |
1 |
11
| 61.1
| 61.1
| 61.1
|
|---|
| 2 |
6
| 33.3
| 33.3
| 94.4
|
|---|
| Over 10 |
1
| 5.6
| 5.6
| 100.0
|
|---|
| Total |
18
| 100.0
| 100.0
|
|
|---|
| 1-3 Years |
Valid |
1 |
108
| 54.3
| 54.3
| 54.3
|
|---|
| 2 |
46
| 23.1
| 23.1
| 77.4
|
|---|
| 3 |
17
| 8.5
| 8.5
| 85.9
|
|---|
| 4 |
7
| 3.5
| 3.5
| 89.4
|
|---|
| 5-10 |
12
| 6.0
| 6.0
| 95.5
|
|---|
| Over 10 |
9
| 4.5
| 4.5
| 100.0
|
|---|
| Total |
199
| 100.0
| 100.0
|
|
|---|
| >4 Years |
Valid |
1 |
165
| 30.2
| 30.2
| 30.2
|
|---|
| 2 |
134
| 24.5
| 24.5
| 54.7
|
|---|
| 3 |
89
| 16.3
| 16.3
| 70.9
|
|---|
| 4 |
39
| 7.1
| 7.1
| 78.1
|
|---|
| 5-10 |
70
| 12.8
| 12.8
| 90.9
|
|---|
| Over 10 |
50
| 9.1
| 9.1
| 100.0
|
|---|
| Total |
547
| 100.0
| 100.0
|
|
|---|
Source: GVU's Ninth WWW User Survey (Conducted April 1998)
URL:http://www.gvu.gatech.edu/user_surveys/
Copyright 1998 GTRC - ALL RIGHTS RESERVED
Contact: www-survey@cc.gatech.edu
For more information or to submit comments:
send email to www-survey@cc.gatech.edu.
GVU's WWW Surveying Team
Graphics, Visualization, & Usability Center
College of Computing
Georgia Institute of Technology
Atlanta, GA 30332-0280
