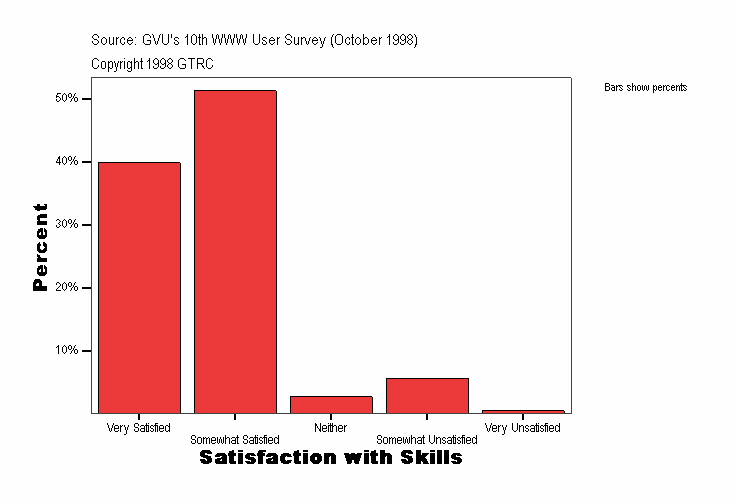
Satisfaction with Skills
|
Frequency |
Percent |
Valid Percent |
Cumulative Percent |
|---|
| Valid |
Very Satisfied |
2002
| 39.9
| 39.9
| 39.9
|
|---|
| Somewhat Satisfied |
2577
| 51.3
| 51.3
| 91.2
|
|---|
| Neither |
135
| 2.7
| 2.7
| 93.9
|
|---|
| Somewhat Unsatisfied |
285
| 5.7
| 5.7
| 99.5
|
|---|
| Very Unsatisfied |
23
| .5
| .5
| 100.0
|
|---|
| Total |
5022
| 100.0
| 100.0
|
|
|---|
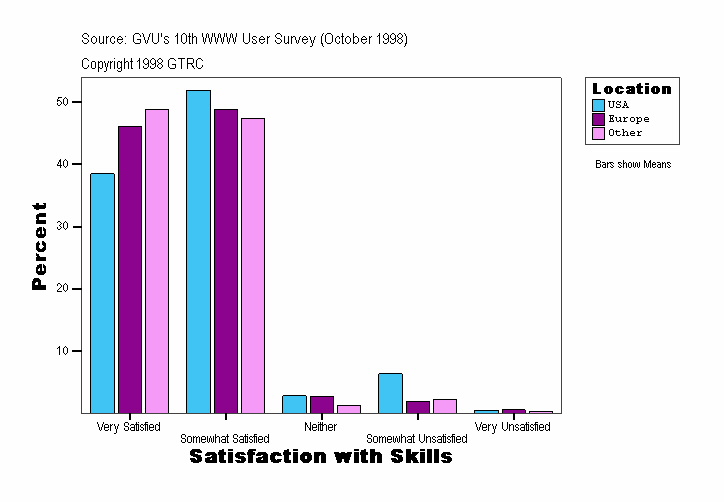
Satisfaction with Skills
| Location |
Frequency |
Percent |
Valid Percent |
Cumulative Percent |
|---|
| USA |
Valid |
Very Satisfied |
1637
| 38.5
| 38.5
| 38.5
|
|---|
| Somewhat Satisfied |
2208
| 51.9
| 51.9
| 90.4
|
|---|
| Neither |
120
| 2.8
| 2.8
| 93.2
|
|---|
| Somewhat Unsatisfied |
269
| 6.3
| 6.3
| 99.5
|
|---|
| Very Unsatisfied |
20
| .5
| .5
| 100.0
|
|---|
| Total |
4254
| 100.0
| 100.0
|
|
|---|
| Europe |
Valid |
Very Satisfied |
170
| 46.1
| 46.1
| 46.1
|
|---|
| Somewhat Satisfied |
180
| 48.8
| 48.8
| 94.9
|
|---|
| Neither |
10
| 2.7
| 2.7
| 97.6
|
|---|
| Somewhat Unsatisfied |
7
| 1.9
| 1.9
| 99.5
|
|---|
| Very Unsatisfied |
2
| .5
| .5
| 100.0
|
|---|
| Total |
369
| 100.0
| 100.0
|
|
|---|
| Other |
Valid |
Very Satisfied |
195
| 48.9
| 48.9
| 48.9
|
|---|
| Somewhat Satisfied |
189
| 47.4
| 47.4
| 96.2
|
|---|
| Neither |
5
| 1.3
| 1.3
| 97.5
|
|---|
| Somewhat Unsatisfied |
9
| 2.3
| 2.3
| 99.7
|
|---|
| Very Unsatisfied |
1
| .3
| .3
| 100.0
|
|---|
| Total |
399
| 100.0
| 100.0
|
|
|---|
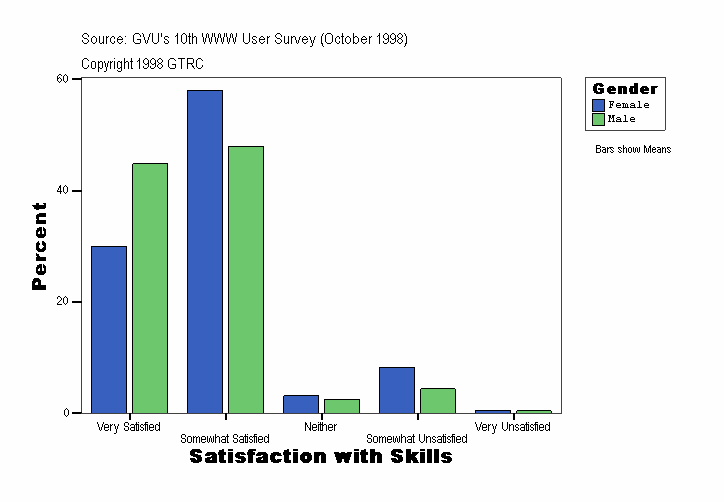
Satisfaction with Skills
| Gender |
Frequency |
Percent |
Valid Percent |
Cumulative Percent |
|---|
| Female |
Valid |
Very Satisfied |
506
| 30.0
| 30.0
| 30.0
|
|---|
| Somewhat Satisfied |
978
| 58.0
| 58.0
| 88.1
|
|---|
| Neither |
53
| 3.1
| 3.1
| 91.2
|
|---|
| Somewhat Unsatisfied |
139
| 8.2
| 8.2
| 99.5
|
|---|
| Very Unsatisfied |
9
| .5
| .5
| 100.0
|
|---|
| Total |
1685
| 100.0
| 100.0
|
|
|---|
| Male |
Valid |
Very Satisfied |
1496
| 44.8
| 44.8
| 44.8
|
|---|
| Somewhat Satisfied |
1599
| 47.9
| 47.9
| 92.7
|
|---|
| Neither |
82
| 2.5
| 2.5
| 95.2
|
|---|
| Somewhat Unsatisfied |
146
| 4.4
| 4.4
| 99.6
|
|---|
| Very Unsatisfied |
14
| .4
| .4
| 100.0
|
|---|
| Total |
3337
| 100.0
| 100.0
|
|
|---|
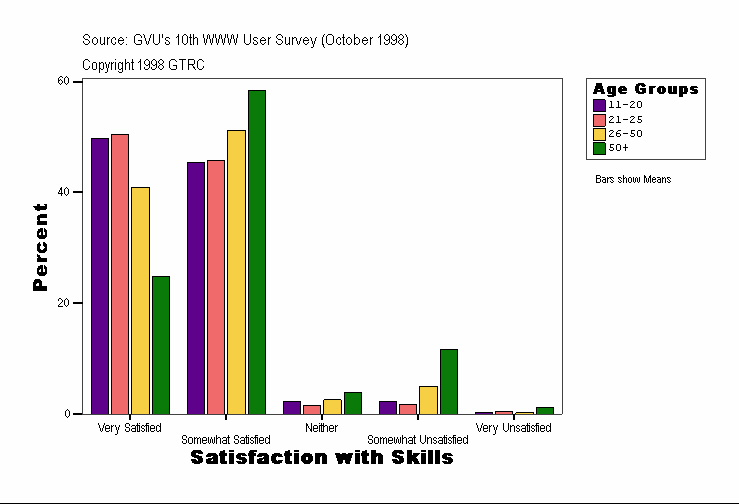
Satisfaction with Skills
| Age Groups |
Frequency |
Percent |
Valid Percent |
Cumulative Percent |
|---|
| . |
Valid |
Very Satisfied |
29
| 34.5
| 34.5
| 34.5
|
|---|
| Somewhat Satisfied |
41
| 48.8
| 48.8
| 83.3
|
|---|
| Neither |
4
| 4.8
| 4.8
| 88.1
|
|---|
| Somewhat Unsatisfied |
9
| 10.7
| 10.7
| 98.8
|
|---|
| Very Unsatisfied |
1
| 1.2
| 1.2
| 100.0
|
|---|
| Total |
84
| 100.0
| 100.0
|
|
|---|
| 11-20 |
Valid |
Very Satisfied |
149
| 49.7
| 49.7
| 49.7
|
|---|
| Somewhat Satisfied |
136
| 45.3
| 45.3
| 95.0
|
|---|
| Neither |
7
| 2.3
| 2.3
| 97.3
|
|---|
| Somewhat Unsatisfied |
7
| 2.3
| 2.3
| 99.7
|
|---|
| Very Unsatisfied |
1
| .3
| .3
| 100.0
|
|---|
| Total |
300
| 100.0
| 100.0
|
|
|---|
| 21-25 |
Valid |
Very Satisfied |
316
| 50.4
| 50.4
| 50.4
|
|---|
| Somewhat Satisfied |
287
| 45.8
| 45.8
| 96.2
|
|---|
| Neither |
10
| 1.6
| 1.6
| 97.8
|
|---|
| Somewhat Unsatisfied |
11
| 1.8
| 1.8
| 99.5
|
|---|
| Very Unsatisfied |
3
| .5
| .5
| 100.0
|
|---|
| Total |
627
| 100.0
| 100.0
|
|
|---|
| 26-50 |
Valid |
Very Satisfied |
1299
| 41.0
| 41.0
| 41.0
|
|---|
| Somewhat Satisfied |
1623
| 51.2
| 51.2
| 92.1
|
|---|
| Neither |
81
| 2.6
| 2.6
| 94.7
|
|---|
| Somewhat Unsatisfied |
160
| 5.0
| 5.0
| 99.7
|
|---|
| Very Unsatisfied |
8
| .3
| .3
| 100.0
|
|---|
| Total |
3171
| 100.0
| 100.0
|
|
|---|
| 50+ |
Valid |
Very Satisfied |
209
| 24.9
| 24.9
| 24.9
|
|---|
| Somewhat Satisfied |
490
| 58.3
| 58.3
| 83.2
|
|---|
| Neither |
33
| 3.9
| 3.9
| 87.1
|
|---|
| Somewhat Unsatisfied |
98
| 11.7
| 11.7
| 98.8
|
|---|
| Very Unsatisfied |
10
| 1.2
| 1.2
| 100.0
|
|---|
| Total |
840
| 100.0
| 100.0
|
|
|---|
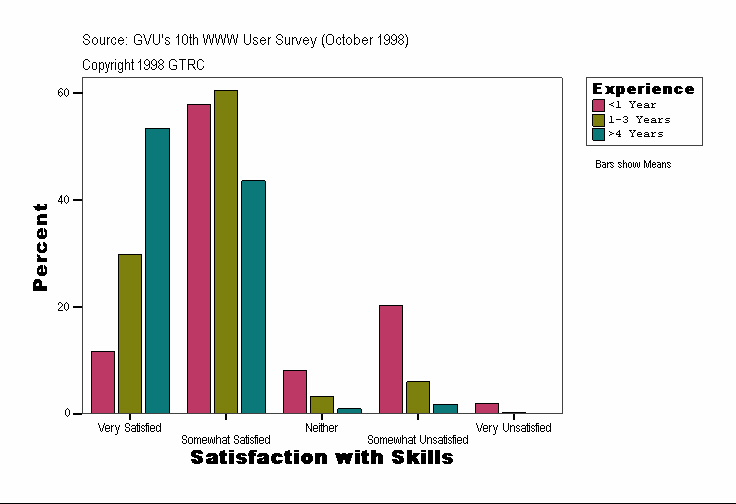
Satisfaction with Skills
| Experience |
Frequency |
Percent |
Valid Percent |
Cumulative Percent |
|---|
| <1 Year |
Valid |
Very Satisfied |
76
| 11.6
| 11.6
| 11.6
|
|---|
| Somewhat Satisfied |
378
| 57.9
| 57.9
| 69.5
|
|---|
| Neither |
53
| 8.1
| 8.1
| 77.6
|
|---|
| Somewhat Unsatisfied |
133
| 20.4
| 20.4
| 98.0
|
|---|
| Very Unsatisfied |
13
| 2.0
| 2.0
| 100.0
|
|---|
| Total |
653
| 100.0
| 100.0
|
|
|---|
| 1-3 Years |
Valid |
Very Satisfied |
519
| 29.9
| 29.9
| 29.9
|
|---|
| Somewhat Satisfied |
1050
| 60.5
| 60.5
| 90.4
|
|---|
| Neither |
57
| 3.3
| 3.3
| 93.7
|
|---|
| Somewhat Unsatisfied |
104
| 6.0
| 6.0
| 99.7
|
|---|
| Very Unsatisfied |
6
| .3
| .3
| 100.0
|
|---|
| Total |
1736
| 100.0
| 100.0
|
|
|---|
| >4 Years |
Valid |
Very Satisfied |
1407
| 53.4
| 53.4
| 53.4
|
|---|
| Somewhat Satisfied |
1149
| 43.6
| 43.6
| 97.1
|
|---|
| Neither |
25
| .9
| .9
| 98.0
|
|---|
| Somewhat Unsatisfied |
48
| 1.8
| 1.8
| 99.8
|
|---|
| Very Unsatisfied |
4
| .2
| .2
| 100.0
|
|---|
| Total |
2633
| 100.0
| 100.0
|
|
|---|
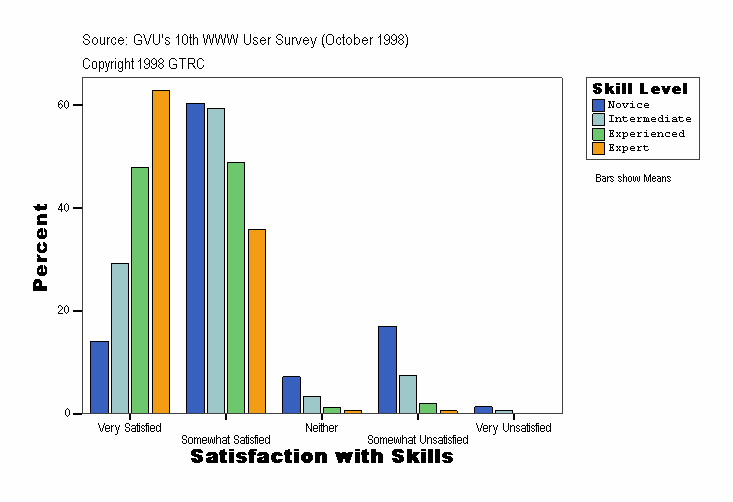
Satisfaction with Skills
| Skill Level |
Frequency |
Percent |
Valid Percent |
Cumulative Percent |
|---|
| Novice |
Valid |
Very Satisfied |
114
| 14.1
| 14.1
| 14.1
|
|---|
| Somewhat Satisfied |
488
| 60.4
| 60.4
| 74.5
|
|---|
| Neither |
58
| 7.2
| 7.2
| 81.7
|
|---|
| Somewhat Unsatisfied |
137
| 17.0
| 17.0
| 98.6
|
|---|
| Very Unsatisfied |
11
| 1.4
| 1.4
| 100.0
|
|---|
| Total |
808
| 100.0
| 100.0
|
|
|---|
| Intermediate |
Valid |
Very Satisfied |
419
| 29.2
| 29.2
| 29.2
|
|---|
| Somewhat Satisfied |
852
| 59.4
| 59.4
| 88.6
|
|---|
| Neither |
49
| 3.4
| 3.4
| 92.0
|
|---|
| Somewhat Unsatisfied |
106
| 7.4
| 7.4
| 99.4
|
|---|
| Very Unsatisfied |
9
| .6
| .6
| 100.0
|
|---|
| Total |
1435
| 100.0
| 100.0
|
|
|---|
| Experienced |
Valid |
Very Satisfied |
888
| 47.9
| 47.9
| 47.9
|
|---|
| Somewhat Satisfied |
906
| 48.8
| 48.8
| 96.7
|
|---|
| Neither |
22
| 1.2
| 1.2
| 97.9
|
|---|
| Somewhat Unsatisfied |
37
| 2.0
| 2.0
| 99.9
|
|---|
| Very Unsatisfied |
2
| .1
| .1
| 100.0
|
|---|
| Total |
1855
| 100.0
| 100.0
|
|
|---|
| Expert |
Valid |
Very Satisfied |
581
| 62.9
| 62.9
| 62.9
|
|---|
| Somewhat Satisfied |
331
| 35.8
| 35.8
| 98.7
|
|---|
| Neither |
6
| .6
| .6
| 99.4
|
|---|
| Somewhat Unsatisfied |
5
| .5
| .5
| 99.9
|
|---|
| Very Unsatisfied |
1
| .1
| .1
| 100.0
|
|---|
| Total |
924
| 100.0
| 100.0
|
|
|---|
Source: GVU's Tenth WWW User Survey (Conducted October 1998)
URL:http://www.gvu.gatech.edu/user_surveys/
Copyright 1998 GTRC - ALL RIGHTS RESERVED
Contact: www-survey@cc.gatech.edu
For more information or to submit comments:
send email to www-survey@cc.gatech.edu.
GVU's WWW Surveying Team
Graphics, Visualization, & Usability Center
College of Computing
Georgia Institute of Technology
Atlanta, GA 30332-0280
